
Key Takeaways
- We do not believe that tech is in bubble territory. We see pockets of irrationality and excess risk-taking, particularly in AI hype names, but this is not pervasive, and it is too extreme to characterize it as a bubble.
- Our underweight positioning to tech reflects our bottom-up investment process.
- While we are underweight tech in US and multi-asset class strategies, we continue to hold meaningful positions in tech names where the strategy fit is strong, and valuations look attractive. We are overweight tech in non-US Equity strategies.
First and foremost, we define technology (tech) exposure as the combination of the Communication Services and Information Technology GICS sectors. Tech spans multiple customer segments (consumer vs. enterprise), business models (advertising, subscriptions, hardware, chips, etc.), and end-markets.
For example, a large internet company monetizing consumer attention via advertising will look and behave a lot differently than a software company selling primarily to Fortune 500 companies. The sector is too large and too diverse to paint with a broad brush, and while our analysts are finding it challenging to generate new ideas – it is not because valuations are extreme across the board, but because they are fair to moderately rich in many cases.
It can’t be a tech discussion without acknowledging the Magnificent Seven. The Magnificent Seven includes Tesla and Amazon, which belong to the Consumer Discretionary GICS sector. As an auto manufacturer, we don’t consider Tesla a tech company. We do view Amazon as a tech company given that its cloud computing business, Amazon Web Services (AWS), makes up more than half of operating income.
Is There a Tech Bubble Coming?
We do not believe there is a bubble forming in tech. A “bubble” is an environment in which irrationality makes its way into asset prices and leads to extreme valuations that are completely disconnected from fundamentals. The characterization that tech is in a bubble is too extreme given what we are seeing on the ground.
Quickly rising share prices are not indicative of a bubble, so long as earnings and free cash flow (FCF) are similarly growing fast – as we’ve seen with Nvidia. At the peak of the dot-com bubble, Cisco, Oracle, and EMC traded at 84-132x forward P/E on earnings estimates, which subsequently declined 50-70% when their customers pulled back on spending. An example today is Nvidia trading at 36x forward earnings, and the stock performance has been driven entirely by earnings growth.
The 1990s Telecom Bubble was even more extreme as the leading names had no earnings or free cash flow, resulting in issuing significant amounts of debt. This is a stark contrast to Microsoft, Amazon, and Google – which are currently funding capex with massive cash flows.
What we are observing is elevated levels of speculative risk-taking in certain pockets of the market. Rapidly rising crypto prices, the return to prominence of “meme” stocks (like Supermicro, a company that makes undifferentiated servers with no clear competitive advantage), and elevated volume in high-risk Zero Days to Expiration (0DTE) options are examples of this. We have observed speculation making its way into the valuations of some perceived AI beneficiaries, and we have avoided these companies or trimmed exposure in a select number of cases. Read our thoughts on the AI Hype Cycle here.
In summary, while there are pockets of excess, our analysis does not show a generalized tech bubble.
Our Tech Positioning
To the extent that we’re underweight tech, it’s a byproduct of bottom-up decisions and our assessment of the risk/reward for stocks on an individual basis. We are not underweight tech because we’re worried about the economy or concerned about a bubble – we are underweight due to the scarcity of opportunities arising from our bottom-up stock selection process.
Despite the weight in tech in our US Equity and multi-asset class portfolios, we continue to hold meaningful positions in tech names in the portfolio, many of which we are overweight compared to the benchmarks. Tech names in which we have held positions over the last year include Amazon, Taiwan Semiconductor, Alphabet, Micron, Meta, ServiceNow, Samsung, and Tencent (the latter two predominantly in non-US accounts).
Overall, it has become increasingly difficult to achieve an equal weight in US tech exposure because of the narrowness of the market and the continued outperformance of the mega-cap tech platforms.
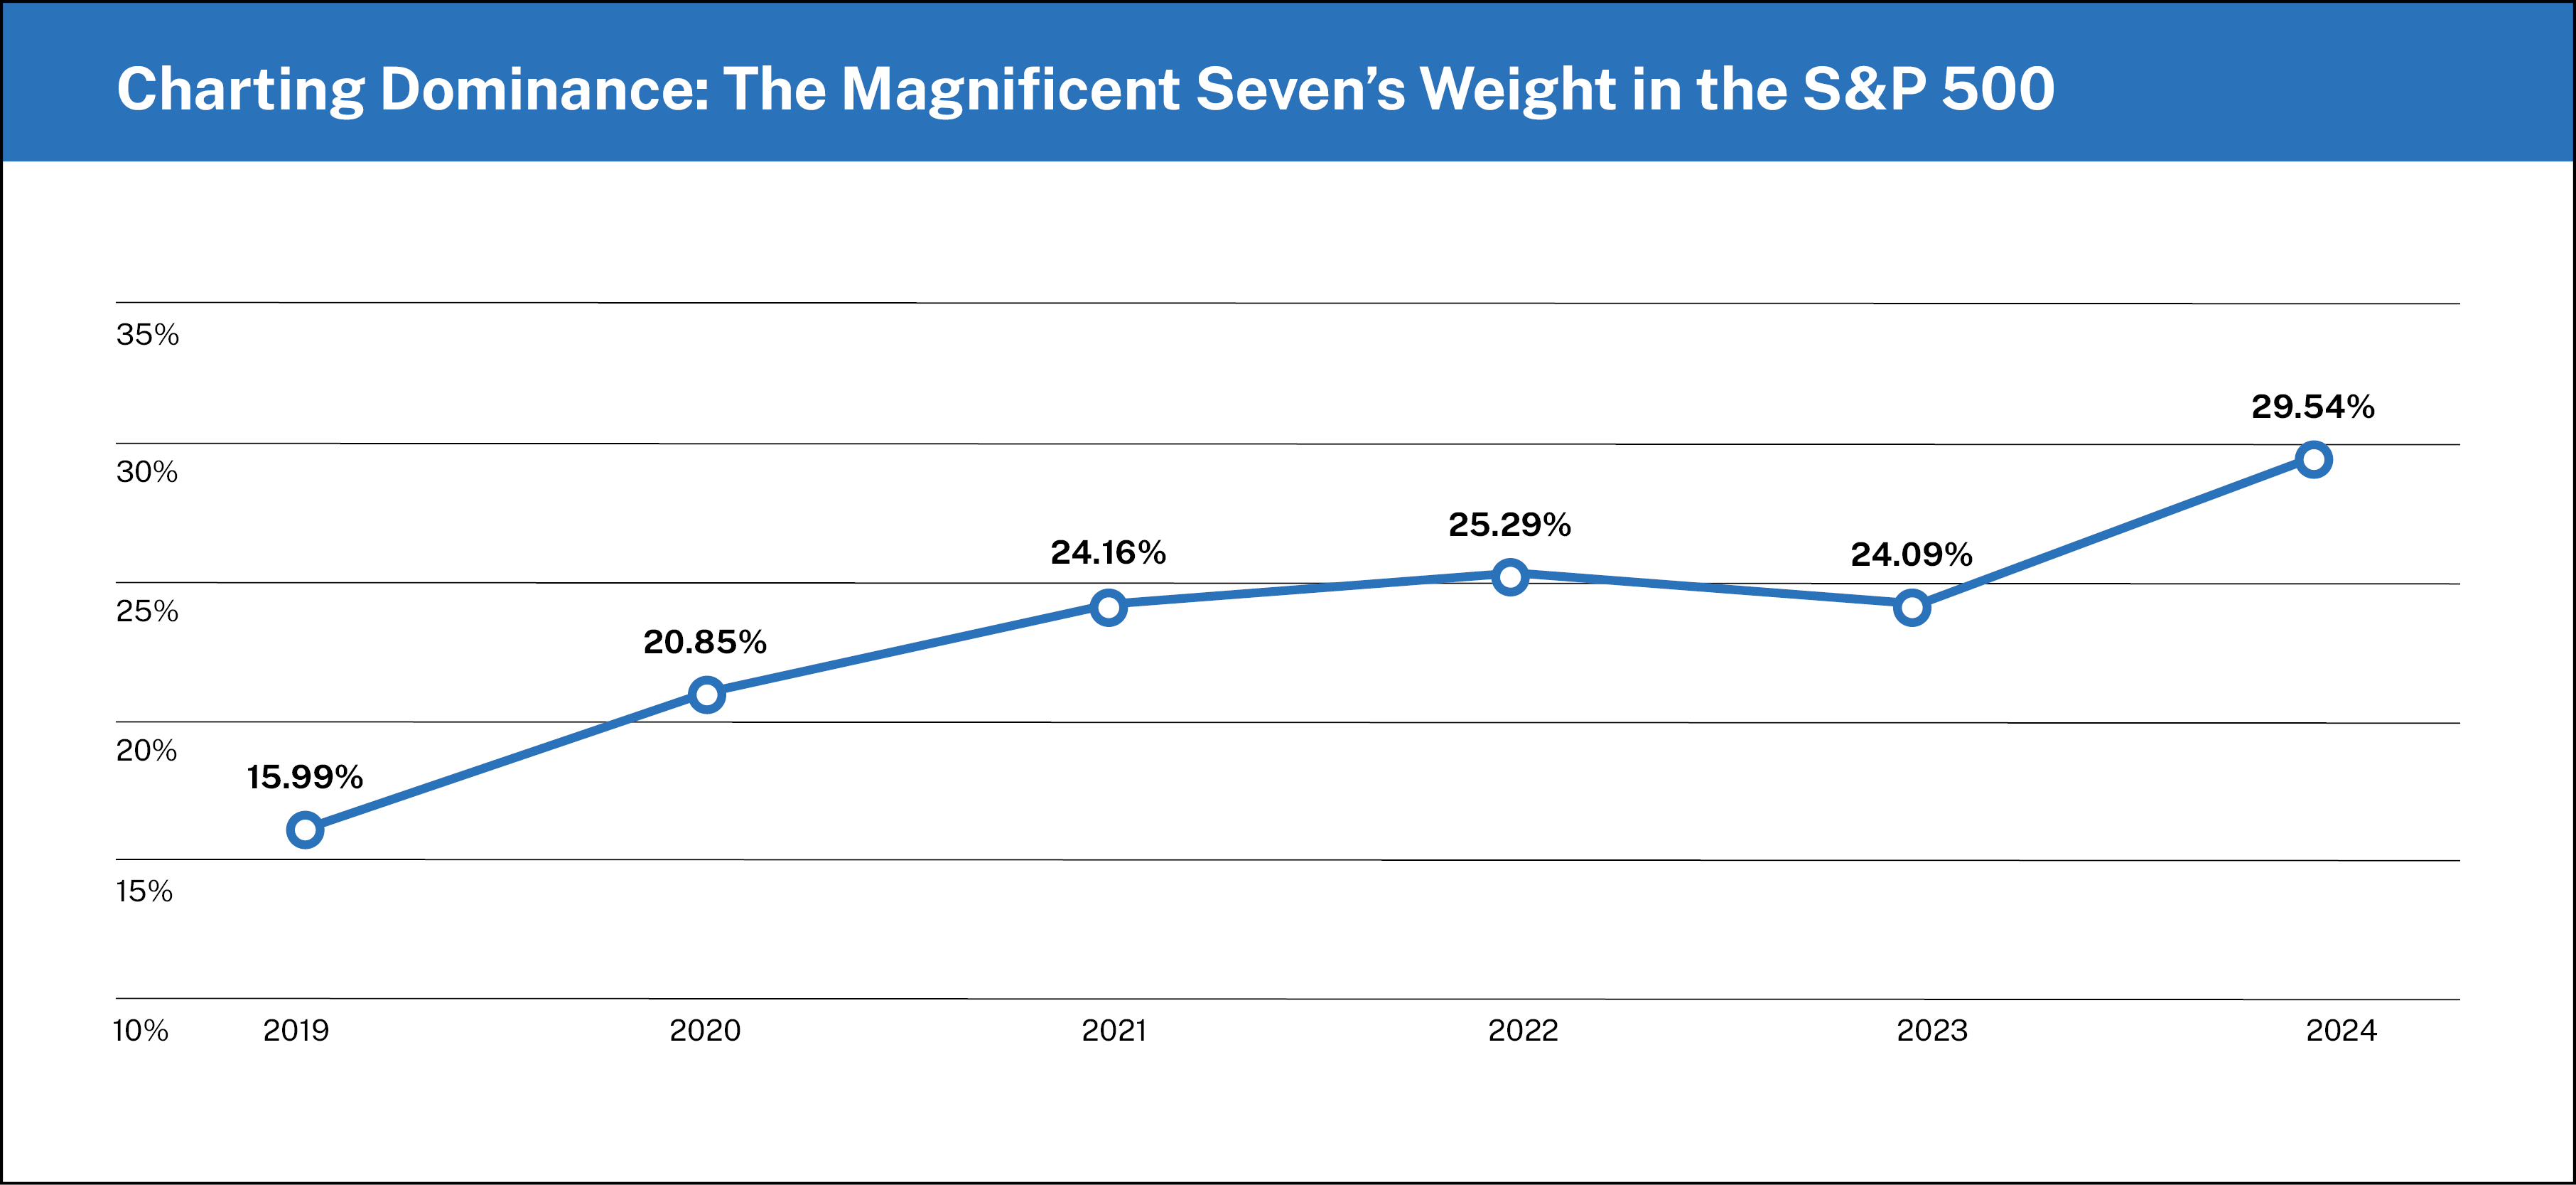
Analysis: Manning & Napier. Source: Bloomberg (2019 – 2024).
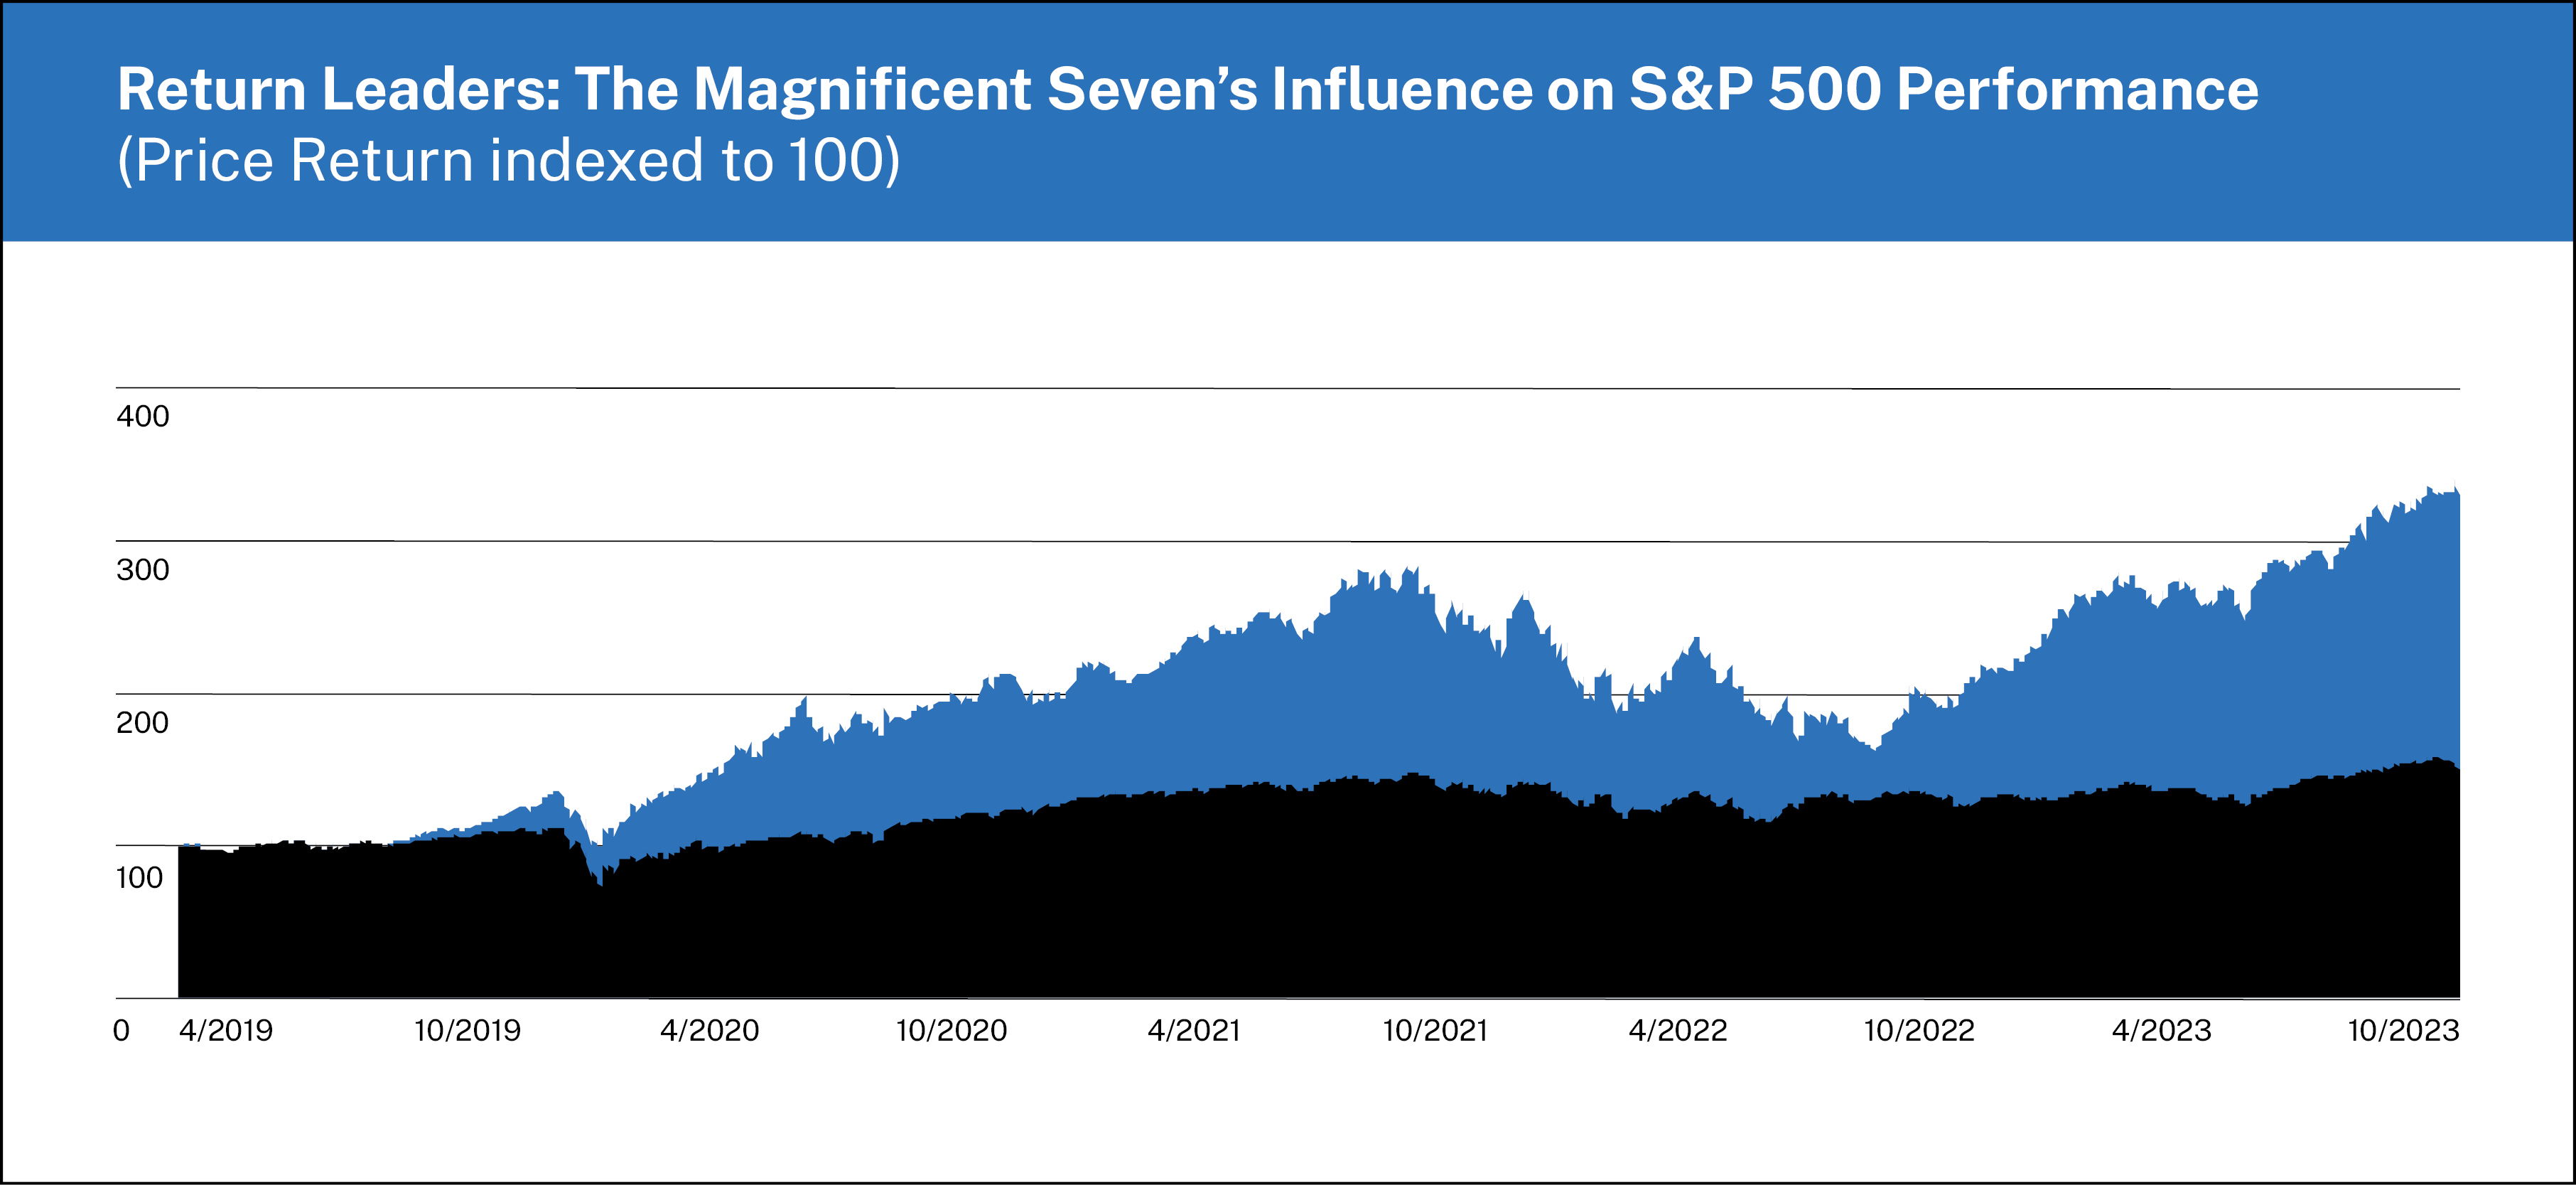
Analysis: Manning & Napier. Source: Bloomberg (4/22/2019 – 4/18/2024).
To further illustrate finding opportunities, the semiconductor industry is one area we point to often showcasing how with our processes, we can favorably balance risks and rewards within our multi-asset class and US equity strategies. For example, these companies, when compared to the leading AI companies, have significantly lower valuation multiples, and we believe they benefit from AI tailwinds on a much better risk-adjusted basis.
Between the pockets of irrationality and excess risk-taking paired with selective opportunities within the Tech space, our continuous monitoring and time-tested processes will allow us to be tactical and calculated as we prepare to take advantage of new opportunities as they present themselves.
Enjoying this information? Sign up to have new insights delivered directly to your inbox.
This material contains the opinions of Manning & Napier Advisors, LLC, which are subject to change based on evolving market and economic conditions. This material has been distributed for informational purposes only and should not be considered as investment advice or a recommendation of any particular security, strategy, or investment product. Information contained herein has been obtained from sources believed to be reliable, but not guaranteed.
The S&P 500 Index is an unmanaged, capitalization-weighted measure comprised of 500 leading U.S. companies to gauge U.S. large cap equities. The Index returns do not reflect any fees or expenses. Dividends are accounted for on a monthly basis. Index returns provided by Bloomberg. Index data referenced herein is the property of S&P Dow Jones Indices LLC, a division of S&P Global Inc., its affiliates ("S&P") and/or its third party suppliers and has been licensed for use by Manning & Napier. S&P and its third party suppliers accept no liability in connection with its use. Data provided is not a representation or warranty, express or implied, as to the ability of any index to accurately represent the asset class or market sector that it purports to represent and none of these parties shall have any liability for any errors, omissions, or interruptions of any index or the data included therein. For additional disclosure information, please see: https://go.manning-napier.com/benchmark-provisions.