
Cash Balance plans are the fastest growing segment of the qualified retirement plan marketplace. At the end of 2001, there were 1,477 Cash Balance plans in the United States, representing 3% of all Defined Benefit plans, while at the end of 2017 there were 18,698 (excluding single-participant plans), representing 40% of all Defined Benefit plans1. The popularity of Cash Balance surged after legislative relief provided by the Pension Protection Act of 2006. Continued popularity among closely held professional employers is due in most part to the large potential allocations to business owners, as well as the way these plans are communicated to and appreciated by participants. An individual aged 55 years could potentially receive an annual allocation of roughly $203,000 in a Cash Balance plan, and roughly $267,000 (as indexed for 2020) in a Cash Balance and §401(k) plan combination.
Watch on-demand: Cash Balance and 401(k) Combination Plan Design Case Study
Learn how a combination of cash balance and 401(k) plans can help business owners increase annual tax-advantaged retirement savings.
Watch nowCash Balance Basics
In a Cash Balance plan, the benefit is defined using a bookkeeping ledger called the Hypothetical Account. The Hypothetical Account receives deposits which are generally based on a percentage of annual pay, and interest credits which are based on either an index or a flat rate known as the Interest Crediting Rate (ICR). A Hypothetical Account is maintained for each plan participant. The plan’s Hypothetical Account is the sum of all the participant Hypothetical Account balances; but is separate and distinct from the actual money invested to provide the benefits defined by it. The rate of return on the actual plan assets—as compared to the plan’s ICR—can have profound implications on the required plan contributions. Employers sponsoring Cash Balance plans must understand that the way plan assets are invested can impact funding policy objectives.
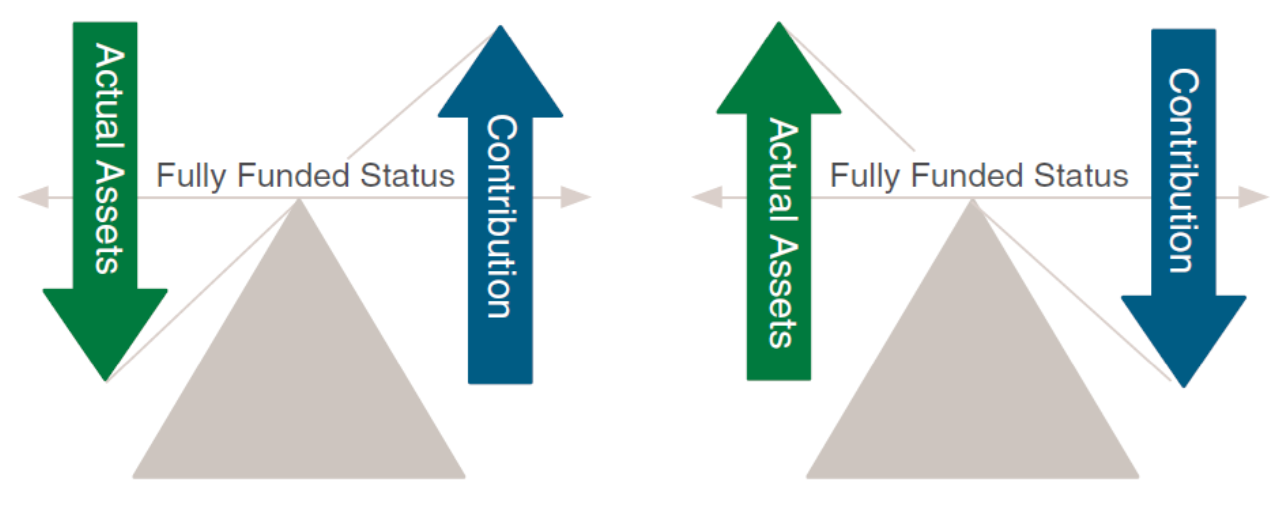
Simplistically speaking, and when all other variables are held constant, to the extent the actual plan assets earn more than the plan’s ICR, the plan can become over-funded causing subsequent contributions to decrease. When the actual plan assets earn less than the plan’s ICR, the plan can become underfunded causing subsequent contributions to increase. Note that certain actuarial, census, and demographic changes can also affect the plan contributions.
Employer Objectives
Certain employers, typically small to mid-sized professional firms, seek to implement a specific annual funding objective—like $375,000 per year for the foreseeable future, for example. They will want to be sure that their annual funding objective will cover the annual benefit cost with a comfortable buffer and with returns on actual plan assets in line with the plan’s ICR over the long-term. This in turn allows them to feel confident that their tax-deductible annual plan contributions will remain relatively consistent and level over the long-term. These objectives are unique, and we refer to this employer profile as Tax Management.
Other employers, typically larger ones, are not as concerned with maintaining a predictably level annual funding objective. They will appreciate assistance from gains in excess of the ICR while recognizing that more aggressive investment postures often entail increased volatility. These plans are large enough to better withstand the vicissitudes of, and greater exposure to, the equity markets than plans sponsored by smaller employers. We refer to this employer profile as Benefit Management, and we generally equate their objective with those of the typical institutional pension sponsor. This paper focuses on employers fitting the Tax Management profile.
Asset Allocation and Plan Contributions
To understand the impact of the asset allocation decision on the employer’s annual funding objective, consider a Cash Balance plan that uses an ICR of 4.5%, and has a Hypothetical Account annual addition of $350,000. As stated, the plan’s benefit is defined by the accumulation of the Hypothetical Account. The plan’s actuary maintains the plan and participant hypothetical accounts and calculates required and recommended contributions as of the last day of each plan year (12/31), reflective of participant benefit accruals and the investment performance of the actual plan assets. For the plan in this example, the Hypothetical Account ledger for the first ten plan years is depicted in the table below.
Hypothetical Account Ledger
| Year | Beginning of Year Balance | Interest Credit (4.5%) | Annual Addition | End of Year Balance |
| 1 | $0 | $0 | $350,000 | $350,000 |
| 2 | $350,000 | $15,750 | $350,000 | $715,750 |
| 3 | $715,750 | $32,209 | $350,000 | $1,097,959 |
| 4 | $1,097,959 | $49,408 | $350,000 | $1,497,367 |
| 5 | $1,497,367 | $67,382 | $350,000 | $1,914,748 |
| 6 | $1,914,748 | $86,164 | $350,000 | $2,350,912 |
| 7 | $2,350,912 | $105,791 | $350,000 | $2,806,703 |
| 8 | $2,806,703 | $126,302 | $350,000 | $3,283,005 |
| 9 | $3,283,005 | $147,735 | $350,000 | $3,780,740 |
| 10 | $3,780,740 | $170,133 | $350,000 | $4,300,873 |
If contributions could be deposited on 12/31 each year, and the actual plan assets could be invested to earn exactly 4.5% each year, the employer could expect its annual plan contributions to be equal to the column labeled “Account Addition”. In each year, the Account Addition column shows the amount required to keep the plan exactly 100% or “fully” funded. But in the real world, it's virtually impossible to make deposits on exactly 12/31 of each year, let alone earn exactly 4.5% each calendar year. Furthermore, many employers are advised to maintain funding levels of 110% of the Hypothetical Account balance (i.e., the plan's liabilities) or more for various reasons. Accordingly, many plans are designed with Hypothetical Account additions that are below the employer's ideal funding objective over the long term. These employers then invest the actual plan assets conservatively and seek to minimize extremes in volatility for reasons we will demonstrate in the next section. Thus, while the cumulative Hypothetical Account addition over 10 years is $3,500,000 the actual funding objective may be $3,750,000 or $3,850,000 per year (i.e. $375,000 or $385,000 per year). Care must be taken during the plan design process to make sure the plan’s Hypothetical Account annual addition is in line with the employer's annual funding goals.
Funded Status by Investment Returns
Let's assume the employer sponsoring the plan described above has a funding goal of $375,000 per year to for 10 years; and would like the actual plan assets to be consistently between 100%-110% of the hypothetical account balance. To demonstrate how the asset allocation decision can affect the funding goal, we can compare the projected accumulation of plan assets over two distinct decades to the hypothetical account balance over the same length of time.
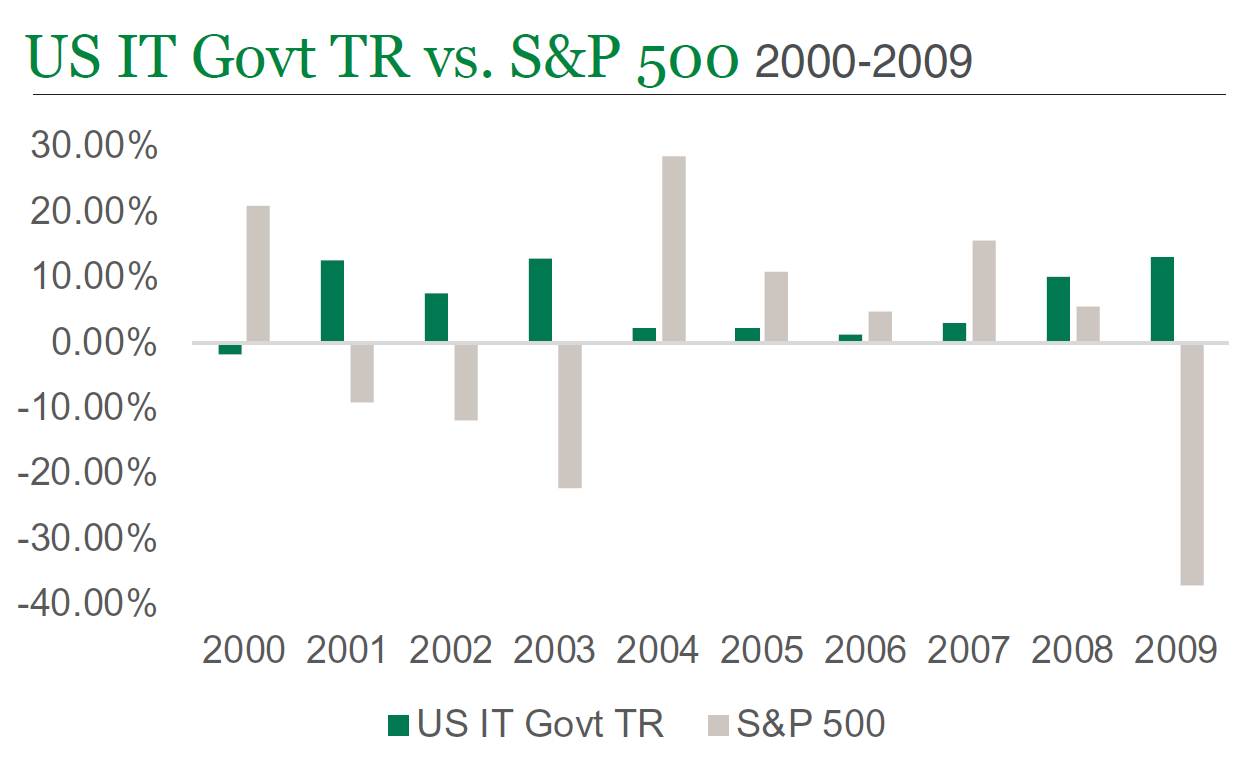
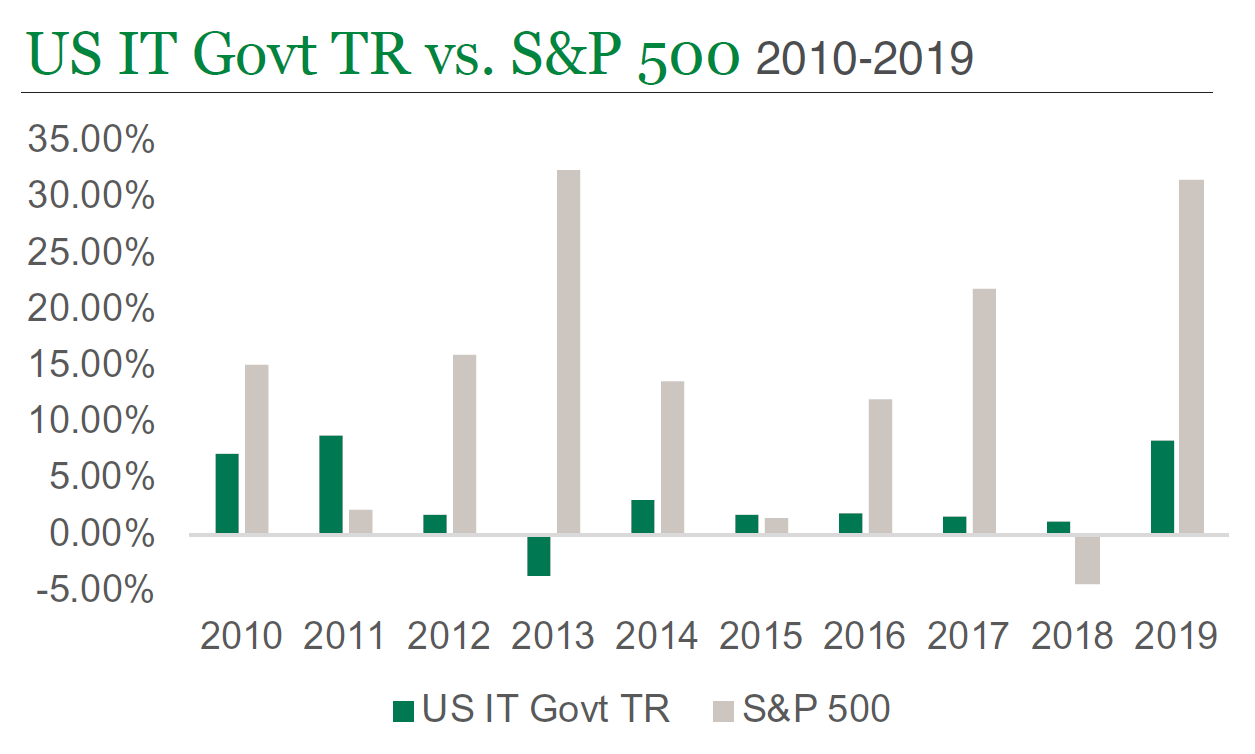
The charts below illustrate the calendar year returns for the Ibbotson Associates US Intermediate Government Treasuries Index2 and the S&P 500 Index3 over the periods 2000-2009 and 2010-2019, representing times during which these indices behaved very differently.
Based on these annual returns, and assuming deposits on 12/31 in each year for each period, we can accumulate annual deposits of $375,000 as if they were invested in four different allocation models:
- 00% US Intermediate Government Treasuries
- 30% S&P 500, 70% US Intermediate Government Treasuries
- 70% S&P 500, 30% US Intermediate Government Treasuries
- 100% S&P 500
The following charts track the ratio of accumulated assets under each of the allocation models listed above, to the Hypothetical Account balance at the end each year during each period; giving us an elementary approximation of the plan's actuarial funding status.
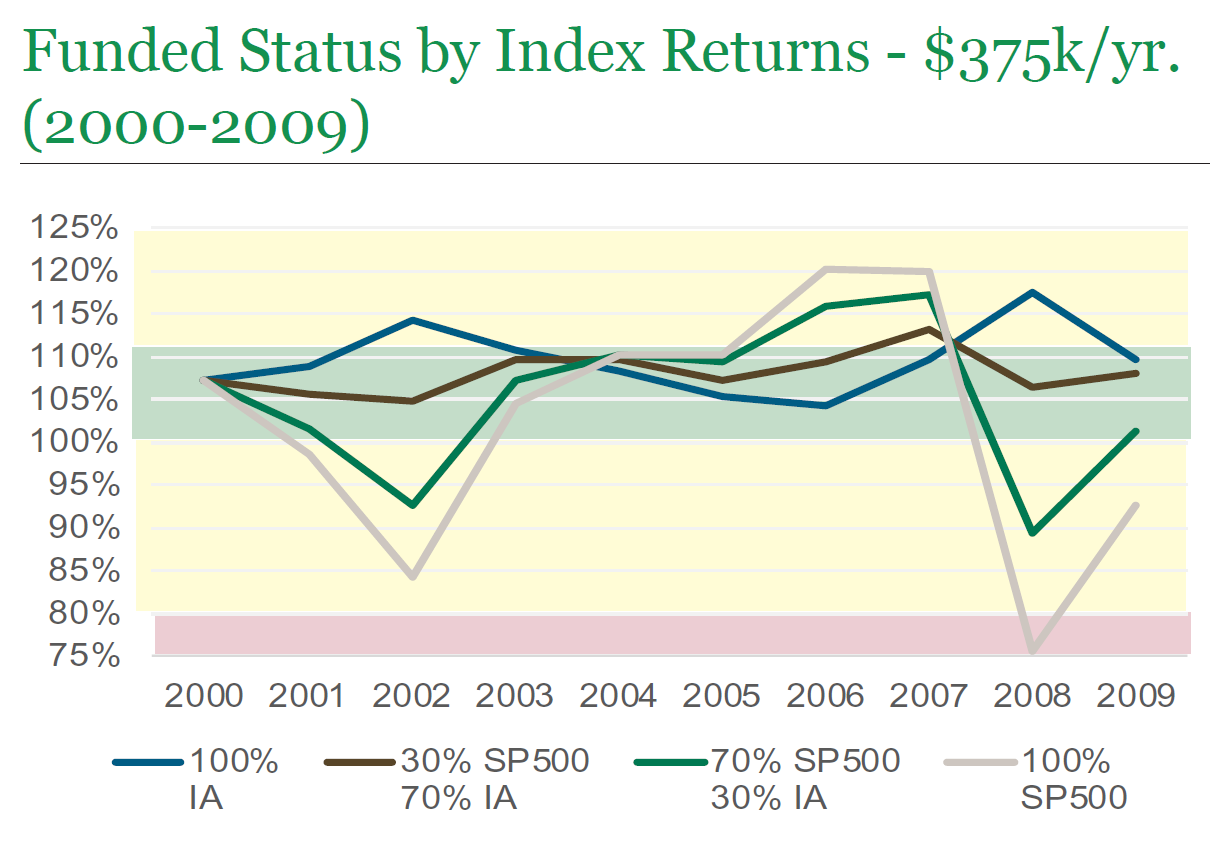
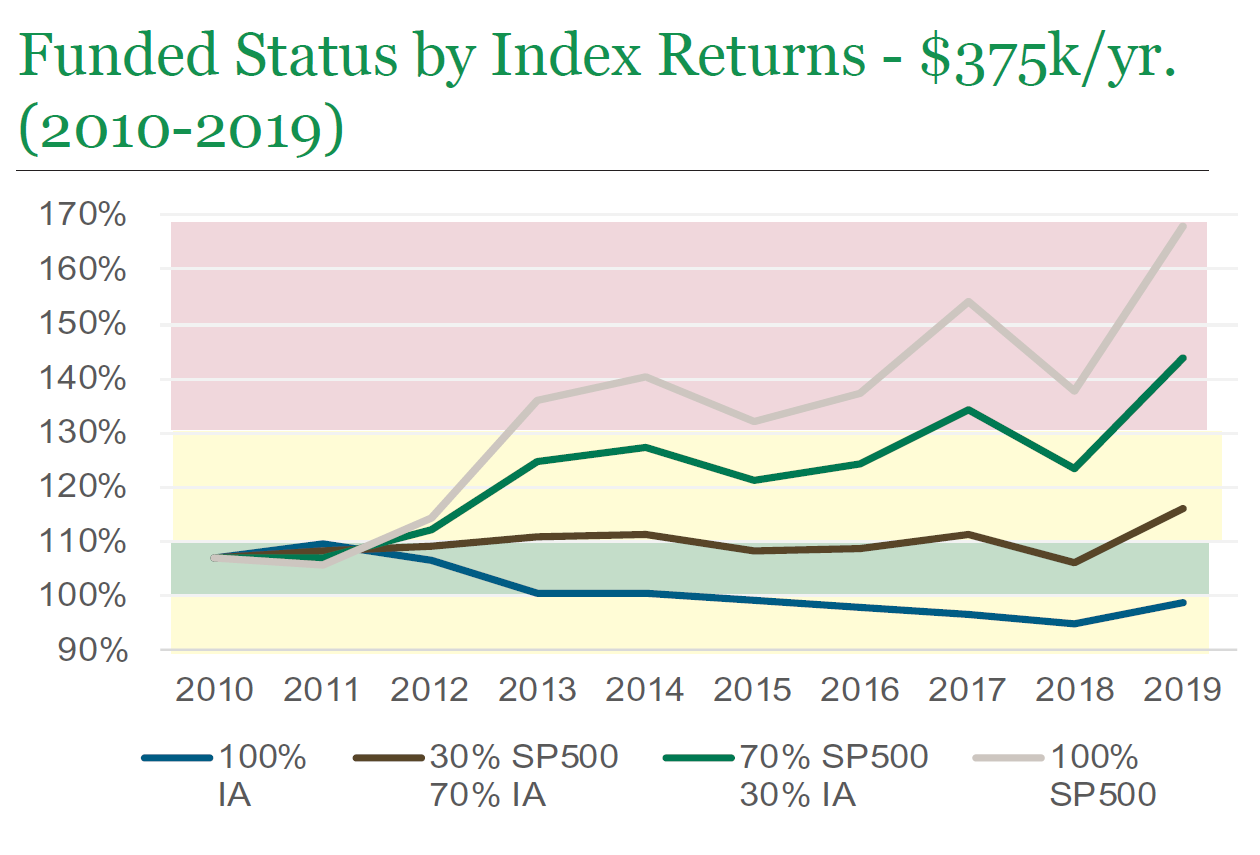
The plot area of each chart above is shaded, to indicate whether the plan's funded status satisfies the employer's objective. If a particular line in the chart remains predominantly in the green region, the employer's funding goal (i.e. $375k/yr.) is essentially intact. When a particular line in the chart drifts out of the green region, the employer's funding goal begins to experience pressure.
The charts show that over either time period, no one allocation model always keeps the plan’s funded status completely in the green zone. Despite this, the most conservative asset allocation models supports the employer's funding goals more than the more aggressive asset allocation models; which tend to put the employer's funding goals under pressure by over-funding the plan in rising equity environments or by under-funding the plan in falling equity environments. When the plan is over-funded, the employer may need to cut back contributions to maintain the desired funded status. When the plan is under-funded, the employer may need to increase contributions to maintain the funded status it requires.
Investing Cash Balance Plan Assets
So, how should the employer invest its Cash Balance plan assets? Closely held professional firms, often have the unique objective of maintaining level annual plan contributions to consistently reduce taxable income to the firm. These employers will appreciate the predictability of a long-term annual funding schedule. They will also want to keep the plan well-funded, desiring a funded status of 100% to 110% (on a termination basis).
Individual and Laddered Bond Portfolios
Most would consider U.S. Treasury bond issues to be more conservative and potentially less volatile than equity issues. However, when the Cash Balance plan actuary performs the plan valuation and calculates the required contribution range, individual bond holdings must be marked to market. This means that if the valuation date is 12/31, then regardless of the maturities and interest rates, individual bond holdings are treated as if they are sold on 12/31. If interest rates have risen as of the valuation date, then the value of an individual bond will decrease. In fact, if rates rise high enough, the portfolio’s returns could actually be negative. Conversely a decline in bond yields may result in significant mark to market gains that limit employer contributions for the year. Larger employers may be more amenable to these swings in Cash Balance plan funding requirements; however, for smaller employers such contribution volatility could be undesirable.
Bond Funds
Another approach that has historically controlled volatility and provided returns that in general support an employer’s Cash Balance plan funding objective, is a standard bond index such as the US Intermediate Government Treasuries, used in the previous example. Accordingly, employers could invest Cash Balance plan assets in all fixed-income mutual or exchange-traded fund. However, risks similar to those of a laddered bond portfolio exist as interest rate changes and investor sentiment impact the fund’s daily-traded share value. Furthermore, if interest rates continue at such low levels, past results may not be achievable for the foreseeable future; and an active management approach becomes a logical consideration.
Combined Equity and Fixed Income Portfolios
A portfolio of equities and fixed income investments is a common investment strategy among Cash Balance plans. These portfolios often have an equity allocation range from 20% to 40%. These allocations are often based on historical analyses that show stocks outperforming bonds over most long-term holding periods. As shown beforehand, a portfolio with an equity allocation of up to 30% will generally support the employer’s funding objective over the long term. To explore this further, note the annualized calendar year returns for the 30% S&P 500, 70% US Intermediate Government Treasuries model fall into the following ranges4:
- -0.51% to 15.23%, 2010-2019, and
- -1.92% to 10.28%, 2000-2009
Despite this wide range in returns the employer’s funding objective across both time periods was never placed under substantive pressure. A quick examination of this portfolio’s annualized performance since 1926 shows it returned between -5% and 15% in approximately 85% of rolling one-year periods; and between 3% and 7% in about two thirds of rolling 10-year periods. Since the typical calendar year-by-year returns would be narrower than these extremes, a conservative portfolio such as this may be a reasonable starting point for many Cash Balance plans meeting this profile.
Our View
We understands employers that sponsor Cash Balance plans can have varying objectives. Some employers desire to reduce their firms’ taxable income through relatively level annual plan contributions (i.e., tax management). Other employers are not as concerned with reducing taxable income as with accumulating significant retirement savings and, thus, appreciate help from additional earnings in excess of the ICR (i.e. benefit management).
Employers seeking to keep the plan funded at a certain level with relatively level and predictable annual plan contributions (and hence tax deductions for the employer) should invest their plan assets conservatively, seeking earnings roughly equivalent to the plan's ICR over the long term, while reducing year-to-year volatility to the extent possible. Actively managed fixed income and conservative multi-asset-class investments are appropriate vehicles to help meet this unique objective. When the return stream is less volatile, the plan's actuary is better able to recommend annual contributions that are relatively consistent from year-to-year and will keep the plan's liabilities funded at the desired level (generally from 100% to 110%).
An active investment approach allows flexibility to adjust between different equity sectors, types of fixed instrument issuers (government, corporate, below invest grade, etc.) and varying maturities based on the current environment becomes instrumental.
Conclusion
Employers that sponsor Cash Balance plans have unique objectives that require unique investment solutions. Keeping all other census and actuarial variables constant, investment returns in excess of the plan’s ICR will tend to reduce the contribution required to maintain fully funded status, and investment returns well below the plan’s ICR will tend to increase the contribution. Certain employers appreciate level annual plan contributions to predictably offset taxable income, and to continually maintain the plan’s funded status at a certain level—e.g. 100% to 110%. As exposure to equities increases, so too will volatility and capital risk, which may be unacceptable to these plans.
For employers fitting the Tax Management profile, it is important to invest assets consistently to meet their unique goals. Since market conditions change drastically over time, an active investment approach aligned specifically with the contribution and funding goals of the plan can help meet their objectives over the life of the plan.
We're here to help
We're always available if you'd like to schedule a call with a member of our team to talk about the current environment, solutions we offer, or other questions top of mind for you.
Schedule a callAll investment strategies involve risks and there is no guarantee of a profit, or protection against a loss.
1Private Pension Plan Bulletin, Abstract of 2017 Form 5500 Annual Reports, Data Extracted on 07/19/2019. Employee Benefits Security Administration, Department of Labor. Excludes plans covering only one participant.
2Fixed Income represented by U.S. Intermediate-Term Government Bonds. U.S. Intermediate Government Bond data is reflective of the Ibbotson Associates SBBI U.S. Intermediate-Term Government Bond Index, which is an unmanaged index representing the U.S. intermediate-term government bond market. The index is constructed as a one bond portfolio consisting of the shortest-term non-callable government bond with no less than 5 years to maturity. The Index returns do not reflect any fees or expenses. Index returns provided by Morningstar.
3Stocks represented by the S&P 500 Index. The S&P 500 Index is an unmanaged, capitalization-weighted measure comprised of 500 leading U.S. companies to gauge U.S. large cap equities. The Index returns do not reflect any fees or expenses. Dividends are accounted for on a monthly basis.
Index returns provided by Morningstar. S&P Dow Jones Indices LLC, a division of S&P Global Inc., is the publisher of various index-based data products and services, certain of which have been licensed for use to Manning & Napier. All such content Copyright © 2019 by S&P Dow Jones Indices LLC and/or its affiliates. All rights reserved. Data provided is not a representation or warranty, express or implied, as to the ability of any index to accurately represent the asset class or market sector that it purports to represent and none of these parties shall have any liability for any errors, omissions, or interruptions of any index or the data included therein.
4Data is based on quarterly rolling returns. Source: Morningstar. Morningstar, Inc. is a global investment research firm providing data, information, and analysis of stocks and mutual funds. ©2019 Morningstar, Inc. All rights reserved. The information contained herein: (1) is proprietary to Morningstar and/or its content providers; (2) may not be copied, adapted or distributed; and (3) is not warranted to be accurate, complete or timely. Neither Morningstar nor its content providers are responsible for any damages or losses arising from any use of this information, except where such damages or losses cannot be limited or excluded by law in your jurisdiction. Past financial performance is no guarantee of future results.