
As 2025 winds down, investors and advisors alike are navigating a landscape shaped by shifting interest rates, evolving markets, and year-end planning to-dos. Understanding what matters most in the months ahead can help you position portfolios—and conversations—for the start of 2026.
1. Review portfolios for a shifting rate environment
The official statement from US monetary policymakers following September’s decision to cut interest rates by 0.25% contained the following comment: “The Committee is attentive to the risks to both sides of its dual mandate and judges that downside risks to employment have risen.” The latter part of that statement provided the necessary context for cutting interest rates at a time when several measures of inflation have remained persistently above the Fed’s 2% target and exhibit few signs of moving lower.
The impact of higher tariffs being passed through to consumers also looms large on the horizon, although many Fed officials have publicly dismissed these concerns as either small or ‘one-off’ impacts. With the field of economics largely considered one of the soft sciences that doesn’t inherently lend itself to natural experiments or controlled trials, history ends up serving as the best guide for policy decision-making. In that regard, we may be approaching a period when Fed officials become keenly aware of wanting to avoid an inflation redux like the US economy experienced in the ‘70s and ‘80s – the last time Consumer Price Index (CPI) inflation spiked in a manner similar to what we experienced in 2022.
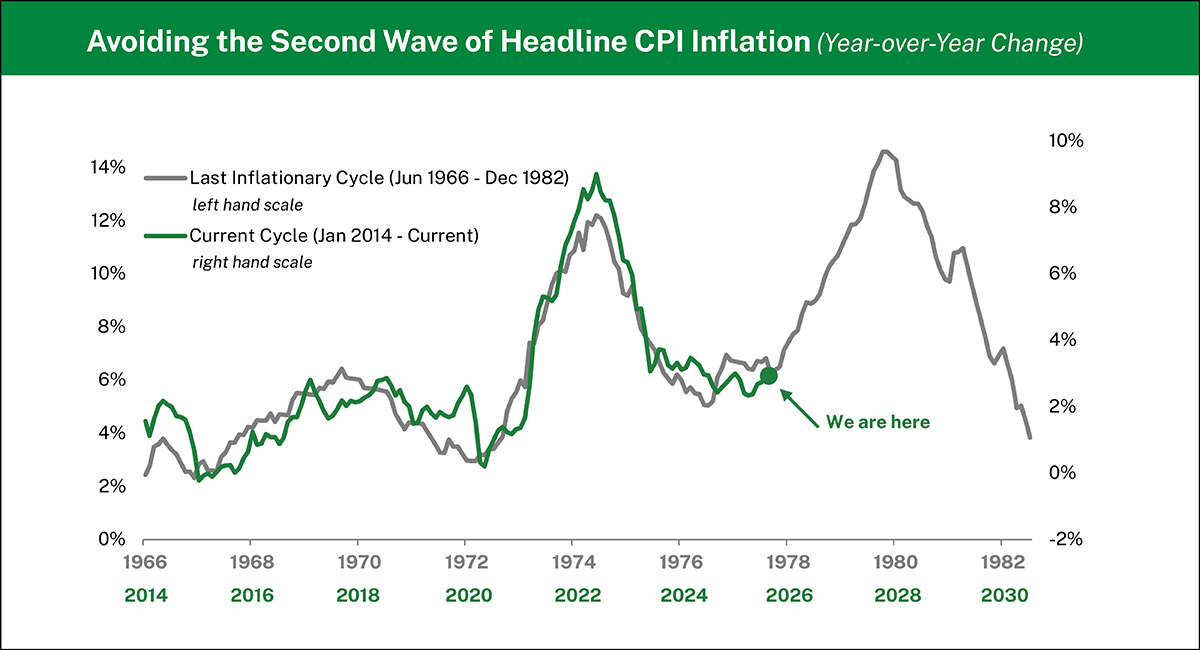
Analysis: Manning & Napier. Source: US Bureau of Labor Statistics (1966-2025).
Despite expectations for additional 0.25% rate cuts at the remaining Federal Open Market Committee meetings this year, the broader picture remains complex. While markets have welcomed the prospect of easier monetary policy, Federal Reserve Chair Jerome Powell recently cautioned that slowing growth, weakening labor market conditions, and persistent inflation present a “challenging situation,” further noting that equity valuations appear “fairly highly valued.” In this environment, risk management and disciplined security selection are paramount. Advisors may also find it timely to revisit portfolio positioning—particularly around duration exposure, cash allocations, and fixed income opportunities—as the evolving rate landscape shapes investment prospects heading into 2026.
2. Reassess tax and retirement contributions before deadlines
As the new year approaches, there are a number of to-dos individuals need to address. Use this outline of key dates and changes during your meetings to keep clients informed and on track.
October
- The Medicare open enrollment period begins, and with employer open enrollment also around the corner, remind your clients to review their plan options and benefits to ensure their healthcare needs are met.
November
- This is the perfect month to remind clients of supporting causes near and dear to their hearts with a charitable giving plan. Review finances year-to-date to plan the donations they can make during giving season.
December
- December 7th: The Medicare open enrollment period ends.
- December 31st:
- Last day for 401(k) contributions
- Deadline to take RMDs from traditional IRA and 401(k) accounts (except for those taking their first RMD).
Notable Limits and Changes for 2025
Contribution limits are updated annually, so it is important to review contributions to identify areas that can be maximized to help clients continue to make progress on their goals.
- HSAs have a contribution limit of $4,300 for singles and $8,550 for families. Those age 55 or older can contribute an additional $1,000.
- IRA or Roth IRA contribution limit remains at $7,000 with a $1,000 catch-up limit for those age 50 or older.
- The contribution limit for 401(k), 403(b), 457, and SARSEPs qualified plans is $23,500 with a $7,500 catch-up contribution limit for those age 50 or older. Those age 60-63 are eligible for a special catch-up contribution of $11,250.
- The new RMD age of 73 applies to all individuals as of 2023. For those who turn 73 in 2025, their first RMD deadline is April 1, 2026, with subsequent RMDs taken by December 31st of each year.
- The federal individual estate tax exclusion and gift tax exclusion is $13,990,000.
- Annual gift tax exclusion (per recipient) increased to $19,000.

2025 Quick Reference Guides
Taxes, Medicare, and Social Security are complex and ever-changing, so we've created free guides with all the information you need for the 2025 tax year, all in one place. Get yours today, and request a free set customized with your logo.
Download3. Understand the current market concentration to help set expectations with clients
Much has been written about the concentrated nature of today’s US equity market, where just a small number of companies command a higher weighting of the S&P 500 compared to any other point in modern history. Nearly all these companies are represented in the Technology and Communication Services sectors, which have propelled the overall index higher and left the rest of the market behind.
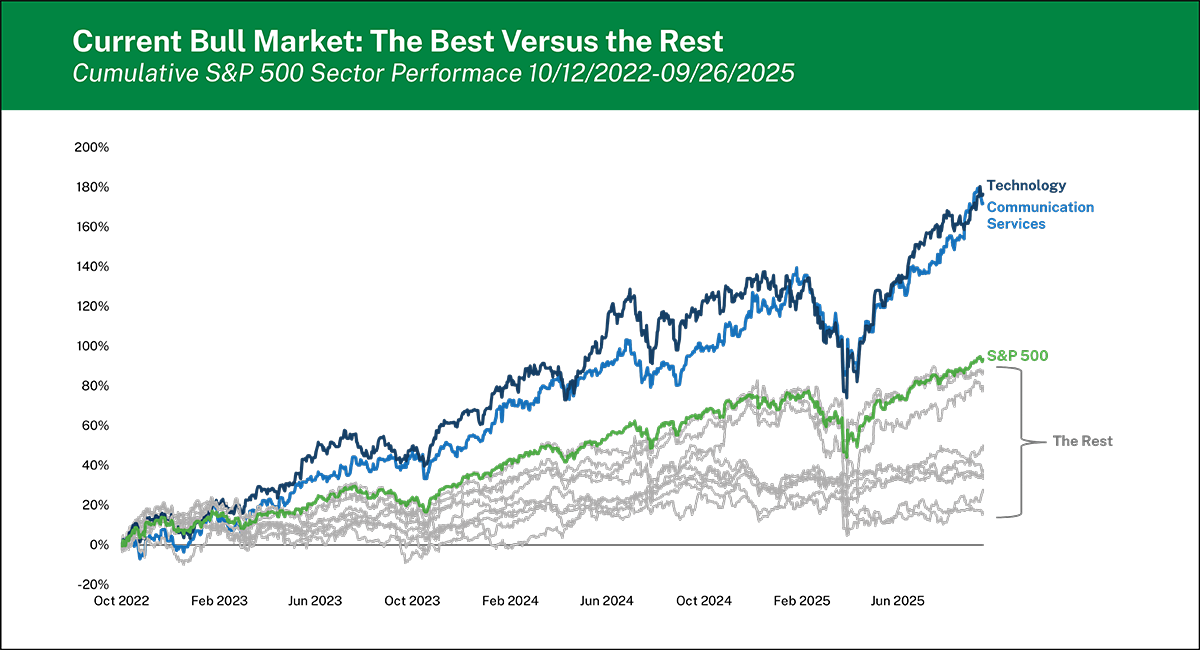
Analysis: Manning & Napier. Source: Morningstar (10/12/2022 – 09/26/2025).
Perhaps equally notable to the concentrated nature of today’s bull market is the degree to which the rest of the market has lagged the overall index’s return. Very few sectors, if any, have trailed the benchmark by more than 10% annualized during the last 4 bull markets. Currently, more than half of the S&P 500 sectors (6 out of 11) are underperforming the overall index by this magnitude.
S&P 500 Sector Performance During Bull Markets |
|||||
|---|---|---|---|---|---|
Start Date |
09/12/1989 |
10/09/2002 |
03/09/2009 |
03/23/2020 |
10/12/2022 |
End Date |
03/26/2000 |
10/09/2007 |
02/19/2020 |
01/03/2022 |
09/26/2025 |
Length |
10.5 years |
5.0 years |
10.9 years |
1.8 years |
3.0 years |
S&P 500 Annualized Return |
18.0% |
16.5% |
18.2% |
53.1% |
25.0% |
# of Sectors |
10 |
11 |
11 |
11 |
11 |
# of Sectors Outperforming S&P 500 |
2 |
7 |
5 |
5 |
2 |
# of Sectors Underperforming by more than 10% (annualized) |
1 |
0 |
1 |
3 |
6 |
Which sectors underperformed by more than 10%? |
Materials |
--- |
Energy |
Utilities, Staples, Health Care |
Health Care, Energy, Staples, Real Estate, Materials, Utilities |
Source: Morningstar, Inc.
Broader participation at the individual stock and sector level typically reflects a “healthier” equity environment—one better positioned to sustain gains over time. However, today’s market remains highly concentrated, with a handful of mega-cap, AI-driven companies accounting for a disproportionate share of overall performance. This extreme concentration serves as both an opportunity and a warning sign should the prevailing growth narrative or related capital expenditures fail to meet lofty expectations.
For advisors, understanding this dynamic is essential as year-end approaches. Concentration risk can leave portfolios more vulnerable than clients realize, underscoring the importance of managing exposure, reinforcing diversification, and setting realistic return expectations. By helping clients look beyond headline index performance and emphasizing active management and prudent risk control, Advisors can position portfolios more effectively for a potentially shifting market landscape in 2026.
4. Understand what short-term noise can teach us about long-term strategy
If history is any guide, the current US government shutdown shouldn’t negatively affect equity markets while things play out, and investors may look forward to higher returns in the months that follow.
S&P 500 Price Returns Around Government Shutdowns |
||||||
|---|---|---|---|---|---|---|
Start Date |
End Date |
Duration (Days) |
1 Month Prior |
During Shutdown |
3 Months Later |
6 Months Later |
09/30/1976 | 10/11/1976 | 11 | 3.1% | (3.4%) | 1.5% | (3.6%) |
09/30/1977 | 10/13/1977 | 13 | 0.2% | (3.2%) | (4.6%) | (3.3%) |
10/31/1977 | 11/09/1977 | 9 | (4.3%) | 0.7% | (2.3%) | 3.7% |
11/30/1977 | 12/09/1977 | 9 | 2.4% | (1.2%) | (5.5%) | 7.5% |
09/30/1978 | 10/18/1978 | 18 | (0.9%) | (2.0%) | (1.5%) | 0.4% |
09/30/1979 | 10/12/1979 | 12 | 0.3% | (4.4%) | 4.6% | (1.2%) |
11/20/1981 | 11/23/1981 | 3 | 1.2% | (0.1%) | (8.4%) | (5.6%) |
09/30/1982 | 10/02/1982 | 2 | 2.3% | 1.3% | 15.3% | 25.4% |
12/17/1982 | 12/21/1982 | 4 | (0.3%) | 0.8% | 11.0% | 25.2% |
11/10/1983 | 11/14/1983 | 4 | (4.8%) | 1.3% | (5.8%) | (5.3%) |
09/30/1984 | 10/03/1984 | 3 | (0.3%) | (2.2%) | 0.6% | 9.5% |
10/03/1984 | 10/05/1984 | 2 | (2.5%) | 0.1% | 0.5% | 9.9% |
10/16/1986 | 10/18/1986 | 2 | 3.4% | (0.3%) | 11.5% | 20.1% |
12/18/1987 | 12/20/1987 | 2 | 1.5% | 0.0% | 8.8% | 7.9% |
10/05/1990 | 10/09/1990 | 4 | (4.0%) | (2.1%) | (0.6%) | 19.2% |
11/13/1995 | 11/19/1995 | 6 | 1.3% | 1.3% | 8.0% | 11.5% |
12/15/1995 | 01/06/1996 | 22 | 3.8% | 0.1% | 6.3% | 6.6% |
09/30/2013 | 10/17/2013 | 17 | 3.0% | 3.1% | 6.8% | 8.3% |
01/19/2018 | 01/22/2018 | 3 | 4.8% | 0.8% | (5.0%) | (0.3%) |
12/21/2018 | 01/25/2019 | 35 | (8.8%) | 10.3% | 10.7% | 13.7% |
09/30/2025 |
??? |
??? |
3.5% |
??? |
??? |
??? |
Average |
9 |
0.2% |
0.0% |
2.6% |
7.5% |
|
Median |
5 |
1.2% |
0.0% |
1.1% |
7.7% |
|
% of time positive |
61.9% |
50.0% |
60.0% |
70.0% |
||
Analysis: Manning & Napier. Sources: Morningstar, Congressional Research Service (1976-2025).
In fact, the “hit rate” of positive returns in the 3- and 6-month periods that follow government shutdowns are almost exactly in-line with historical norms, but the average and median 6-month forward performance (~7-8%) is slightly above the historical figure of approximately +5%.
With this in mind, it is important to remind clients that short-term political or policy headlines rarely derail long-term financial goals. A government shutdown often generates market noise and investor anxiety, but history shows that markets tend to recover quickly once uncertainty passes.
5. Leverage income-focused planning to drive client outcomes
As Advisors meet with clients for year-end reviews, income-oriented investments can play a critical role in supporting both short- and long-term financial objectives. Dividend-paying equities, bonds, preferred shares, and income-focused strategies can provide reliable cash flow that can help clients manage living expenses, plan for RMDs, or fund charitable giving while navigating market volatility.
Year-end is an ideal time to assess whether current allocations are meeting income goals, evaluate tax implications, and consider potential shifts for 2025. By integrating income-oriented strategies into client portfolios thoughtfully, Advisors can enhance financial resilience, tailor solutions to individual needs, and reinforce the value of proactive, goal-focused planning.
Each year leaves its own imprint on investors, and 2025 is no different. The takeaways from today’s market environment—around discipline, diversification, and opportunity—will carry forward into 2026. The key is to use these insights to guide how you move forward.
Income-Oriented Solutions for Your Clients
Our time-tested investment strategies and disciplined valuation approach provide a strong foundation to help navigate uncertainty with confidence. Backed by a comprehensive suite of income solutions tailored to every investor profile, we can help you meet your clients’ objectives across all market environments.
Explore our income-oriented solutionsReturns for the Consumer Price Index represent an estimate of the average price of consumer goods and services purchased by households, given the market price change for a constant basket of goods and services from one period to the next. Index returns provided by US Bureau of Labor Statistics.
The S&P 500 Total Return Index is an unmanaged, capitalization-weighted measure comprised of 500 leading U.S. companies to gauge U.S. large cap equities. The Index returns do not reflect any fees or expenses. The index accounts for the reinvestment of regular cash dividends, but not for the withholding of taxes. Index returns provided by Bloomberg. Index data referenced herein is the property of S&P Dow Jones Indices LLC, a division of S&P Global Inc., its affiliates ("S&P") and/or its third party suppliers and has been licensed for use by Manning & Napier. S&P and its third party suppliers accept no liability in connection with its use. Data provided is not a representation or warranty, express or implied, as to the ability of any index to accurately represent the asset class or market sector that it purports to represent and none of these parties shall have any liability for any errors, omissions, or interruptions of any index or the data included therein.
The Global Industry Classification Standard (GICS) was developed by and is the exclusive property and a service mark of MSCI Inc. (MSCI) and Standard & Poor’s, a division of S&P Global Inc. (S&P), and is licensed for use by Manning & Napier when referencing GICS sectors. Neither MSCI, S&P, nor any third party involved in making or compiling the GICS or any GICS classifications makes any express or implied warranties or representations with respect to such standard or classification, nor shall any such party have any liability therefrom.
The S&P 500 Price Return Index is an unmanaged, capitalization-weighted measure comprised of 500 leading U.S. companies to gauge U.S. large cap equities. The Index returns do not reflect any fees, expenses, or adjust for cash dividends. Index returns provided by Morningstar, Inc. S&P Dow Jones Indices LLC, a division of S&P Global Inc., is the publisher of various index based data products and services, certain of which have been licensed for use to Manning & Napier. All such content Copyright © 2025 by S&P Dow Jones Indices LLC and/or its affiliates. All rights reserved. Data provided is not a representation or warranty, express or implied, as to the ability of any index to accurately represent the asset class or market sector that it purports to represent and none of these parties shall have any liability for any errors, omissions, or interruptions of any index or the data included therein.
Morningstar, Inc. is a global investment research firm providing data, information, and analysis of stocks and mutual funds. ©2025 Morningstar, Inc. All rights reserved. The information contained herein: (1) is proprietary to Morningstar and/or its content providers; (2) may not be copied, adapted or distributed; and (3) is not warranted to be accurate, complete or timely. Neither Morningstar nor its content providers are responsible for any damages or losses arising from any use of this information, except where such damages or losses cannot be limited or excluded by law in your jurisdiction. Past financial performance is no guarantee of future results.
For additional index disclosure information, please see: https://go.manning-napier.com/benchmark-provisions.
Past performance is not an indication of future results. All investments contain risk and may lose value. This material contains the opinions of Manning & Napier Advisors, LLC, which are subject to change based on evolving market and economic conditions. This material has been distributed for informational purposes only and should not be considered as investment advice or a recommendation of any particular security, strategy, or investment product. Information contained herein has been obtained from sources believed to be reliable, but not guaranteed.