
The increased scrutiny target date funds have received following the global stock market downturn of 2008 and early 2009 highlights the importance of understanding their structures and mechanics, with particular attention paid to the glide path. However, it is also important to acknowledge that the losses experienced during this negative market environment were not unique to target date funds, and were experienced by a wide range of investment options. In fact, target date funds may help participants avoid common investing mistakes, such as a lack of diversification among investments and transfers into areas of the market based on strong recent performance (i.e., performance chasing), which in turn may result in better participant outcomes. For example, a study conducted by Burgess + Associates determined that more than 80% of non-life cycle participants would have achieved better results if they had invested in a single life cycle portfolio1.
There have been a number of industry developments geared toward increasing the retirement preparedness of participants. Perhaps most notably, Congress passed the Pension Protection Act of 2006 (PPA). One of the primary goals of the PPA was to increase participation levels within defined contribution retirement plans (e.g., 401(k) plans) by enabling employers to adopt automatic enrollment and escalation features. Plan fiduciaries are provided safe harbor protection if they designate certain investments as the default option for participants who fail to make an investment election. Specifically, to receive fiduciary relief, default assets must be: (1) invested in one of three designated Qualified Default Investment Alternatives (QDIA); (2) prudently selected; and (3) monitored on an ongoing basis.
The Department of Labor selected target date options, along with balanced or lifestyle options and managed accounts, as the three types of QDIAs. In response, defaulted assets have been directed away from capital preservation options (e.g., money market and stable value) into diversified investment portfolios such as target date funds, which have emerged as the predominant QDIA choice among fiduciaries. As a result, defaulted participants (e.g., often young participants with extended time horizons) now have a greater opportunity to accumulate retirement assets and potentially become better prepared for retirement than they otherwise would have been, particularly in comparison to the generation currently entering retirement. This trend is expected to continue, as more defined contribution retirement plans adopt automatic features.
While plan fiduciaries have an increasing number of target date funds from which to choose, determining which fund family best meets the needs of plan participants can be a challenge. To help reduce the chances of future mismatches between the expectations of plan fiduciaries and the reality of how various target date fund families are structured and subsequently perform, target date providers should clearly communicate the factors considered and the assumptions made in constructing their glide path. Academic studies have determined that more than 90% of a portfolio’s variability of returns can be attributed to the asset allocation decision2, indicating that the asset allocation decisions along the glide path are likely to be the most important factor influencing a target date fund’s long-term performance. With that in mind, the following details Manning & Napier’s Glide Range methodology, including the factors considered and assumptions made during the construction process.
Glide Paths Vary Widely Across Providers
In the wake of the 2008 financial crisis, it has become a fairly well known fact that glide paths vary substantially among target date providers. Based on data obtained from Morningstar Inc., Chart 1 illustrates the variation among target date providers’ glide paths.
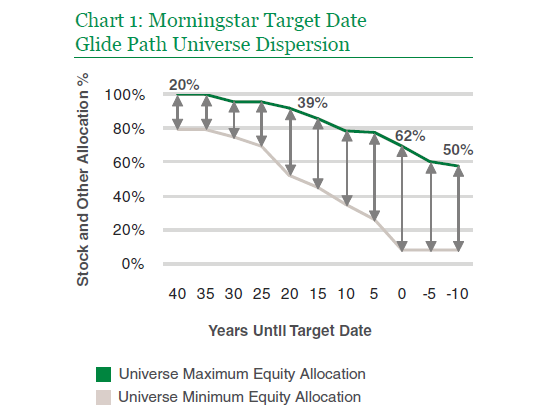
It appears there is a general consensus among target date providers as to the appropriate equity allocation at the start of the glide path (i.e., only 20% dispersion). However, as the target date nears, the difference in equity allocation among the target date providers increases, and is greatest at the target date (i.e., 62% dispersion). The target date marks an important transition point in the glide path, as a shift from saving to spending occurs. Not surprisingly, target date providers’ differing views on how to balance capital risk, longevity risk, and inflation risk only increases as the target date nears. To be clear, capital risk can be defined as the danger that the portfolio will lose principal over a specified investment time frame, while longevity risk is the danger that a participant will outlive their assets. In addition, inflation risk can be defined as the chance of lost purchasing power resulting from negative inflation-adjusted returns.
Unfortunately, there isn’t an easy answer when it comes to balancing these risks. Focusing too heavily on limiting longevity and inflation risk may result in exposure to significant market volatility when there is an insufficient amount of time to recoup investment losses, especially in the face of ongoing withdrawals to meet retirement living expenses. In contrast, focusing too heavily on limiting capital risk may result in inadequate long-term returns and the increased chance of outliving one’s retirement assets.
The significant variation among providers’ glide paths has generally been criticized. However, fiduciaries may find it more constructive to view this variation as an opportunity to select the most appropriate glide path for their participant base. Naturally, the differences in assumptions have a large impact on the shape of the glide path. In addition, the overall approach utilized in the construction of the glide path can also vary by provider. For example, a provider may set their target asset allocations using mean-variance optimization in an attempt to maximize the risk/return relationship based on long-term historical asset class data (e.g., returns, volatility, and correlations). However, many of the strategies employed by target date providers tend to correlate closely with a basic rule of thumb, where equity exposure should be determined by subtracting the participant’s current age from 1203. Using this approach, a 50 year old participant would simply allocate 70% of their portfolio to stocks.
Manning & Napier Glide Range Factors and Assumptions
Regardless of the approach taken, Manning & Napier strongly believes it is critical for target date managers to effectively communicate the key factors that they have considered and assumptions that they have made in constructing their glide paths. The primary factors considered and assumptions made by Manning & Napier in developing the Glide Range are listed below and are based on Manning & Napier’s 40 years of experience in helping a variety of clients meet their retirement goals.
Time Horizon
It is assumed that by age 25 participants have been in the work force for at least a year and have started contributing to their 401(k) plan. Furthermore, it is generally expected that the majority of participants will spend approximately 40 years in the workforce, reaching retirement between ages 60 - 70. In addition, given life expectancy trends, it is expected that participants will spend approximately 20 - 30 years in retirement. For situations where two lives are involved (e.g., a married couple), it can be very important to consider the potential term of survival of at least one of the parties since the life expectancy of the surviving party in a two life case is always longer than the life expectancy of either independent individual. For example, the survivor of a 65 year old couple has a 50% chance of living to at least age 894.
Contribution Level
The more participants contribute, the less reliant they become on market returns for the growth needed to build up their retirement portfolio balances. In fact, even small increases in contributions, particularly early on in a participant’s career, can have a large impact on retirement wealth. Furthermore, in addition to a participant’s own contributions, many employers make discretionary match contributions up to a certain dollar amount or percentage of the participant’s salary as an employee benefit. A common employer match is 50% of the participant’s contribution, up to a maximum of 3% of the participant’s salary. If a participant were to maximize this particular employer match benefit, they would be responsible for contributing 6% to their 401(k) account. In turn, they would receive a 3% employer matching contribution resulting in a total annual contribution of 9%.
While contribution rates can vary significantly at the participant and plan level, according to the most recent survey conducted by the Profit Sharing/401(k) Council of America (PSCA), the average percentage of salary deferred (pre-tax and after tax) for all eligible participants was 6.4%5. Given industry trends, such as the PSCA’s findings on participant contribution behavior, Manning & Napier’s general assumption is that the combined participant and employer match contribution will likely fall within a 6% - 12% range throughout the accumulation phases of the Glide Range. While the contribution rate clearly has an impact on the retirement preparedness of participants (e.g., income replacement ratio), it is important to note that it does not significantly influence the asset allocation decision throughout the Glide Range.
Income Replacement Needs
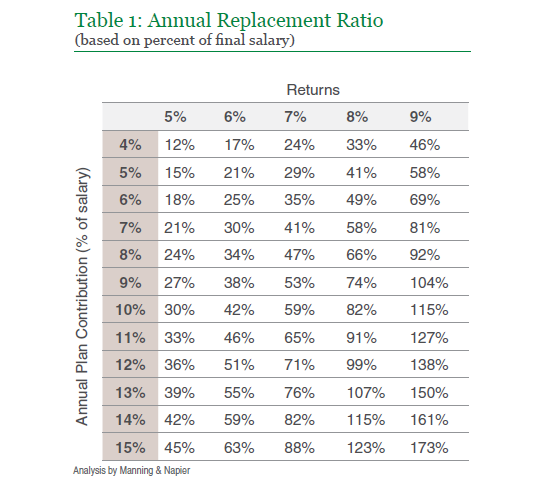
By retirement, participants are no longer making retirement contributions and the majority of their debt (e.g., mortgage) is often paid off. As a result, a participant may not need to replace 100% of their final working year’s salary. However, expenses such as health care often increase drastically during retirement. In fact, health care expenses are of particular concern as they have generally risen at a faster pace than overall inflation. With these factors in mind, Manning & Napier believes that, in addition to any Social Security income received, participants will likely need to replace 50% - 70% of their final working year’s salary to meet their retirement spending needs. As illustrated in Table 1, a participant’s annual income replacement ratio can vary significantly and is not simply a function of market returns. Savings behavior (e.g., how early and how much a participant contributes) is also a significant driver, and most importantly, one that he/she has full control over. Specifically, Table 1 illustrates the impact various total plan contribution rates and returns have on annual income replacement ratios for a young participant, (i.e., age 25) likely just entering the workforce. It should be noted that delaying the start of contributions until after age 25 would lead to lower income replacement ratios, all else being equal, reinforcing the importance of saving diligently early on in a participant’s career.
Key Assumptions
- Participant starts saving at age 25
- Annual salary increases of 3% per year
- Participant retires at age 65
- Participant lives until age 90
Withdrawal Behavior
While defined contribution plans were originally created to be supplementary savings plans, outside of Social Security, they have in many cases become the sole source of a participant’s retirement income. Therefore, Manning & Napier recognizes that participants’ target date portfolios may account for a significant portion of their total retirement assets. Ideally, the initial withdrawal rate will be limited to a 4% - 6% range and adjusted annually for inflation thereafter to maximize the potential for the portfolio lasting throughout a participant’s lifetime. However, given the challenges facing participants in trying to save for retirement, coupled with the fact that average participant balance data suggests that many participants are behind schedule in their retirement savings plan, Manning & Napier conservatively assumes that initial annual withdrawals could be as high as 8% at the target date.
As retirement progresses there are a variety of reasons to assume participants’ retirement portfolios may begin to be drawn down at a more rapid rate. These reasons may include, but are not limited to, a sustained rise in overall price levels (i.e., inflation), rising health care related costs, and participants depleting any non-401(k) assets (e.g., bank savings account). As a result, Manning & Napier conservatively assumes participants’ annual withdrawals will grow to exceed 8% per year approximately five years after the target date.
Glide Range Driven by Market Conditions, Not Assumptions
The assumptions previously discussed were utilized in determining the broad asset allocation ranges along the Manning & Napier Glide Range. As an example of the broad ranges utilized, at the target date, the Glide Range provides the flexibility for the equity allocation to range from 20% - 60%, with a midpoint of 40%. However, the specific asset allocation at any particular point along the Glide Range is primarily driven by the prevailing economic and market conditions. To build upon the previous example, when Manning & Napier’s security selection strategies and pricing disciplines indicate that equities offer attractive absolute returns, the Glide Range will likely be positioned with an above midpoint weighting to equities (i.e., 40% - 60%). Likewise, when Manning & Napier’s strategies and disciplines imply that the equity markets do not offer attractive long-term returns, the Glide Range will likely have a below midpoint weighting to equities (i.e., 20% - 40%). Therefore, given the importance of prevailing market conditions in determining the specific asset mix at any point in time, if a plan fiduciary were to determine that one or more of Manning & Napier’s assumptions may not align with their particular plan’s demographics, the Glide Range may still be an appropriate overall choice. In contrast to the flexibility embedded in the Glide Range, many glide path approaches available in the industry today are highly dependent on specific assumptions. Most often, target date providers utilize a variety of assumptions to arrive at a single strategic target asset allocation at each point along the glide path (e.g., 35% equity allocation at the target date). Therefore, if a target date provider were to change one of their assumptions (e.g., contribution rate) the target asset allocations along the glide path would also likely change.
Valuations Matter
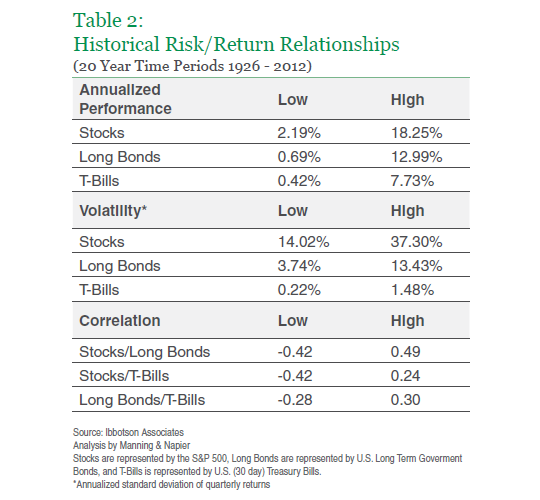
While average or median rates of return are often utilized throughout the financial industry as a tool for positioning portfolios, it is important to understand that returns are likely to vary and may significantly differ from the long-term average over time periods as long as 20 years. As illustrated in Table 2, stock returns have ranged from 2.19% - 18.25% over rolling 20 year time periods since 1926.
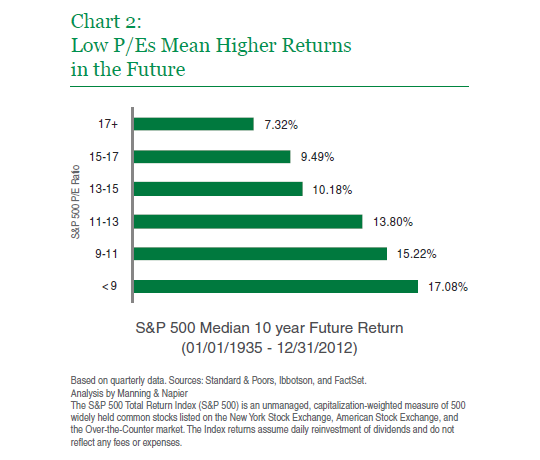
Therefore, instead of relying on past average returns, it may be more beneficial to focus on the strong connection between prevailing market conditions and future returns. As an example, consider the relationship between Price to Earnings Ratio (P/E ratio) and future returns of the S&P 500 Index. Based on Ibbotson data dating back to 1926, the median rolling 10 year return of the S&P 500 Index was 11.80% as of 12/31/2012. However, as illustrated in Chart 2, the starting P/E level had a significant impact on the chances of experiencing returns above or below that median return. The clear conclusion is that if you buy into the market when valuations are high, your expected return should generally be lower. The opposite holds true as well: when you buy into the market at low valuations, your expected return should generally be higher.
History has shown that participants’ portfolio performance is dependent on the changing market and economic environment. Therefore, Manning & Napier believes there is no single, predetermined glide path that can meet the needs of participants in all environments. Furthermore, since the future is so uncertain, how can any target date provider possibly pinpoint the optimal asset allocation years in advance (e.g., determine the appropriate asset allocation for someone turning 65 years old 30 years in the future)? Unfortunately, a significant number of the solutions offered in the industry today are constructed to systematically reduce equity exposure on a yearly basis without regard for the prevailing market conditions.
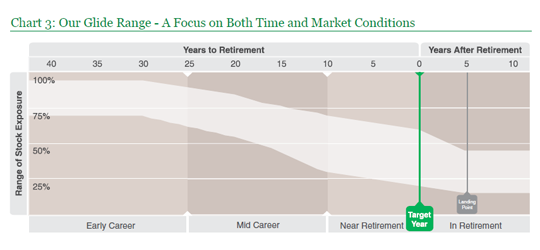
Manning & Napier Glide Range
Manning & Napier employs a Glide Range that not only transitions toward a more conservative allocation as the target date nears, but also offers the flexibility to actively adjust the asset allocation within a broad asset allocation range based on prevailing market and economic conditions. A key goal of target date options is to allow participants to delegate what is widely considered the most important investment decision (i.e., translating investment objectives to a specific asset allocation) to an investment professional. Therefore, target date funds must incorporate a glide path schedule that fully takes into consideration a participant’s changing investment objectives over time. The roll down schedule of the Manning & Napier Glide Range (illustrated in Chart 3) reflects Manning & Napier’s recognition of the unique goals related to three key accumulation phases encountered during a participant’s working life (i.e., Early Career Phase, Mid Career Phase, and Near Retirement Phase), as well as the Retirement Phase.
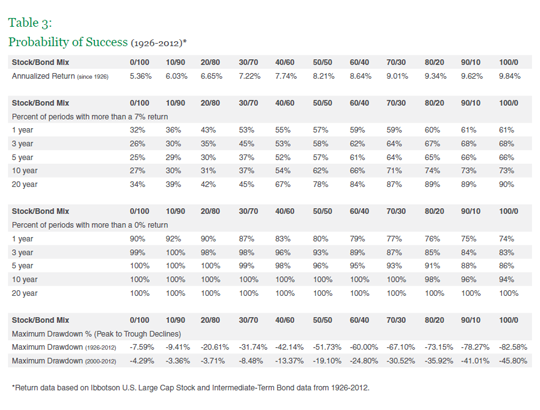
To better understand the importance of utilizing broad asset allocation ranges throughout the Manning & Napier Glide Range, consider the historical frequency of a variety of asset allocations achieving a growth-oriented return of 7% and a positive return (i.e., return greater than 0%) over various rolling time periods. Based on the data illustrated in Table 3, there are several observations that can be made.
- Higher stock allocations have generally led to a greater likelihood of meeting target rates of returns over various rolling time periods. For example, an 80% stock/20% bond portfolio has achieved at least a 7% return in 74% of the rolling 10 year time periods. In contrast, a 20% stock/80% bond portfolio has returned at least 7% in only 31% of the rolling 10 year time periods since 1926.
- However, greater equity exposure also increases the chances of significant capital losses, particularly over short to intermediate-term time frames. For example, an 80% stock/20% bond portfolio has returned above 0% in only 76% of rolling one year time periods while a 20% stock/80% bond portfolio has earned positive annualized returns in 90% of the same one year rolling time period.
- Finally and most importantly, the data shows that no single static asset allocation is likely to meet investment goals in every environment. Therefore, providing the flexibility to adjust the asset allocation in response to a changing market environment is an important element of achieving a better financial future for plan participants.
The following details the four Phases of a participant’s retirement savings cycle (Early Accumulation Phase, Peak Accumulation Phase, Late Accumulation Phase, and the Retirement Phase) as illustrated in Chart 3.
Early Career Phase
The Early Career Phase begins when a participant first enters the workforce and lasts until approximately 25 years before retirement. This phase is typically characterized by strong growth in portfolio balances, as those relatively new to the workforce accumulate retirement savings through contributions and market appreciation. Significant exposure to equities during the early accumulation phase reflects participants’ long-term growth-oriented goals. Most participants maintain a primary goal of long-term capital growth, and are willing to accept potential portfolio volatility in exchange for the long-term returns that equity markets have historically provided. Significant market losses are less of a concern during this phase as participants often have relatively little savings to lose and they have ample time to recover from any capital losses they may incur (i.e., ongoing annual contributions have a larger impact on participant balances at this point than market value fluctuations). During this Phase the Manning & Napier Glide Range begins to gradually shift 30 years prior to the target date from an equity range of 70% - 95% ultimately reaching a 62% - 90% range, with a midpoint equity allocation of 76%, 25 years prior to the target date. Based on the Ibbotson data previously referenced, an asset mix towards the lower end of the Glide Range during the Early Accumulation Phase (e.g., 70% stocks/30% bonds) has achieved an annualized return of 7% or more in 87% of the rolling 20 year time periods since 1926.
Mid Career Phase
The Mid Career Phase begins approximately 25 years prior to the target date and lasts until approximately ten years prior to the target date. During this phase, long-term capital growth is still the primary goal; however, capital preservation is now a secondary concern. Many participants have accumulated meaningful portfolio balances and have typically entered their most fruitful earning years. Therefore, some emphasis should be placed on capital preservation. However, with approximately 10–25 years until retirement, most participants are willing to tolerate a moderate level of volatility and have the flexibility to dedicate a meaningful allocation to equities. As a result, the Manning & Napier Glide Range begins to gradually shift from an equity range of 62% - 90% to a range of 30% - 70%, with a midpoint equity allocation of 50%, ten years prior to the target date. Based on the Ibbotson data previously referenced, asset allocations within this range have had general success in achieving at least 7% growth more often than not. For example, a portfolio consisting of 50% stocks/50% bonds has achieved an annualized return of at least 7% in 62% of the 10 year time periods. In addition, losses over the intermediate-term have been generally muted. To build upon our previous example, positive returns for a 50% stocks/50% bonds portfolio have occurred in 96% of the rolling five year time periods since 1926.
Near Retirement Phase
The period beginning 10 years prior to retirement is the Late Accumulation Phase. At this stage retirement is in sight, thus making capital preservation a highly meaningful consideration. However, considering that those participants on the brink of retirement will still likely need their retirement assets to fund annual spending needs for 20–30 years, long-term capital growth continues to be an important goal. Therefore, the objective shifts from a primary goal of long-term capital growth to an objective that balances equal goals of capital preservation and capital appreciation during this Phase. Specifically, the equity allocation range is gradually reduced from 30% - 70% to 20% - 60%, with a midpoint of 40%. It is during this Phase that the broad equity allocation range is at its widest (i.e., 40%) allowing Manning & Napier the flexibility to provide meaningful exposure to equities when they are attractively priced. However, equity exposure can reach as low as 20% of the portfolio when warranted, thus limiting capital risk exposure. Risk management is critical at this point as participants may accumulate upwards of 50% of their retirement balance in the last five to ten years leading up to retirement. Based on the Ibbotson data previously referenced, asset allocations within this range significantly reduce the potential for sustained losses. For example, an asset mix towards the upper end of the Glide Range during the Late Accumulation Phase (e.g., 60% stocks/40% bonds) has experienced positive returns in 95% of rolling five year time periods. Furthermore, the potential for significant growth still exists as an asset mix towards the lower end of the Glide Range during the Late Accumulation Phase (e.g., 30% stocks/70% bonds) has managed to return at least 7% in approximately 44% of rolling three year time periods since 1926.
In Retirement Phase
The Retirement Phase begins at the target date and marks an important inflection point in participants’ lives. Specifically, the tailwind of contributions during the accumulation phases turn into a headwind in the form of withdrawals. While participants are unable to control the market environment in which they retire, one of the factors they do have at least some control over is the rate at which they draw down their assets. As illustrated in Chart 4, the amount withdrawn from a portfolio directly impacts how likely the assets are to last through a 25 year Retirement Phase.
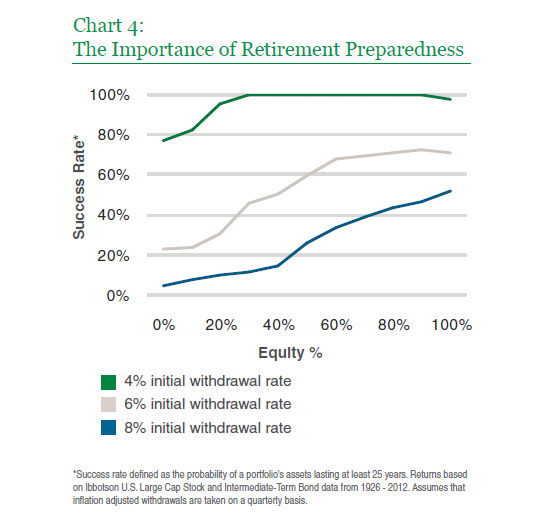
Based on the data illustrated in Chart 4, the following observations can be made:
- For participants entering retirement with portfolio balances large enough to require only a 4% initial withdrawal rate, the chances of depleting their retirement assets prematurely, regardless of their asset mix, is fairly limited.
- In contrast, for participants requiring an initial withdrawal rate of 8%, depletion of capital is a very real possibility. Specifically, at this particular withdrawal rate, the success rate never surpasses 50%, regardless of the asset mix. Thus, a prudent investment approach when encountered with withdrawal rates reaching upwards of 8% is to focus on preserving capital and dampening market volatility in an attempt to reduce the rate at which the assets are drawn down so they can last as long as possible.
- For each of the withdrawal rates, (as we also observed based on the data illustrated in Table 3) the probability of success generally increases as the equity allocation increases. Participants, unsurprisingly, tend to get rewarded for increasing their exposure to capital risk over extended time horizons. However, this analysis doesn’t address the impact sustained losses may have on retirees’ portfolios. Therefore, it is important to consider the magnitude of potential losses in conjunction with probabilities of success.
The combination of a severe market downturn (particularly early on in retirement) and the resulting increase in withdrawal rates can lead to a premature exhaustion of a retirement portfolio’s assets. As an example, Chart 5 illustrates the impact of taking on significant capital risk (via equity exposure) at the beginning of a retirement that coincides with three severe market downturns. Specifically, the cumulative excess market value of a 75% Stock/25% Bond Portfolio (Aggressive Portfolio) relative to a portfolio consisting of a 25% Stock/75% Bond mix (Conservative Portfolio) at the beginning of the Great Depression of 1929 (green line), the bear market and inflationary period of 1973 (gray line), and the start of the past decade, which included two severe bear markets (blue line), are illustrated.
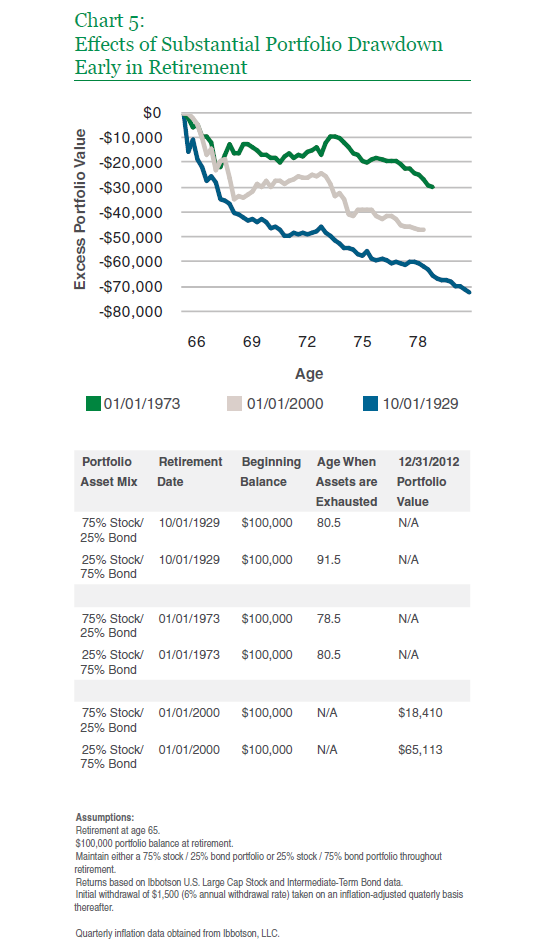
In all three scenarios, the benefits of a capital preservation focus are realized (to varying degrees). In the Great Depression scenario, a retiree’s asset mix was of particular importance. Specifically, the Conservative Portfolio lasted 11 years longer when compared to the Aggressive Portfolio. A retiree in 1973 was faced with the likelihood of running out of assets prematurely, regardless of the asset mix. However, the more Conservative Portfolio did manage to last two years longer, extending income generation until age 80.5. Finally, while the future is uncertain, participants who retired in 2000 invested in the Conservative Portfolio are currently in much better shape, with a portfolio balance that is approximately 254% greater than that of the Aggressive Portfolio, as of 12/31/2012.
Manning & Napier assumes participants will begin to draw down their retirement portfolio at a more rapid rate (i.e., exceeding 8% per year) approximately five years past the target date. Therefore, based on our analysis reflecting the increased importance of capital preservation as withdrawal rates increase, the Glide Range reaches its most conservative equity range of 15% - 45%, with a midpoint equity allocation of 30%, at that time. While preservation of capital becomes the primary focus, its secondary objectives are to provide income and long-term growth of capital.
Extended life expectancies and long-term inflation are very real factors that warrant most participants maintaining at least a modest equity allocation throughout retirement. The effects of inflation can be both gradual and profound. For example, assuming an average annual inflation rate of 3%, the purchasing power of $1 of savings would be more than halved, to $0.48 in 25 years. In addition, consider that the investment returns earned while in retirement will likely end up funding the majority of a participant’s spending in retirement.
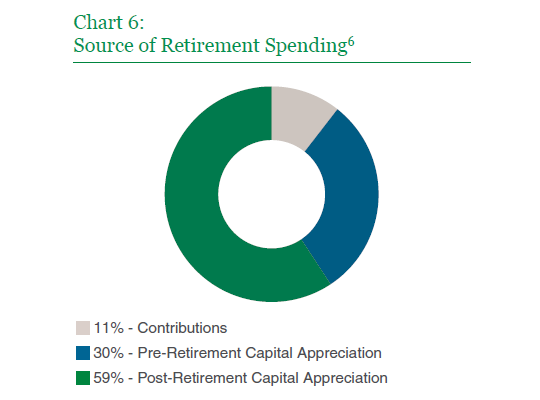
To build upon the assumptions utilized in Table 1, nearly 59% of this hypothetical participant’s cumulative spending during a planned 25 year retirement would be generated from the growth of his/her portfolio during retirement (i.e., illustrated in Chart 6). Furthermore, this 59% post-retirement capital appreciation is in addition to the approximate 30% that would have been generated via pre-retirement capital appreciation. This example reiterates the importance of capital appreciation throughout all phases of a participant’s lifetime, including retirement.
Inevitably, some participants will elect to receive their benefits in the form of a lump sum payment at the target date. However, many participants will likely continue to need the help of a professional money manager in hopes of meeting their investment goals well beyond the target date. In fact, many participants will likely continue to need help managing their retirement portfolio for the next 20–30 years. Therefore, Manning & Napier’s Glide Range continues maintaining a flexible equity range beyond the target date based on the assumption that many participants will remain invested well into retirement. Furthermore, this flexible range limits the potential of having to sell equity securities at temporarily depressed prices to address participants’ withdrawal needs.
Based on the Ibbotson data previously referenced, a portfolio at the higher end of the equity range during this phase (i.e., 40%) has achieved a return of at least 7% in 55% of rolling one year time periods. Therefore, there is still ample opportunity to position the portfolio for growth when the market environment is favorable. However, negative returns over the short-term have been limited to only 4% of rolling three year time periods for portfolios with less than a 40% allocation to equities since 1926.
Furthermore, over the past 12 years (2000-2012), a period of time that included two significant bear markets, the maximum draw down (i.e., the largest drop in an investment’s value during a given period before it returned to its previous high) within the 15% - 45% asset allocation range never surpassed 17%. In comparison, a portfolio fully invested in stocks reached a maximum draw down of nearly 46% over the same time period.
Conclusion
As the U.S. retirement system continues to transition from a defined benefit to a defined contribution focus, target date funds will likely play an increased role in helping participants meet their retirement goals. Up to this point, it appears much of the fiduciary focus has been on general target date concepts (e.g., diversification and the existence of a glide path), and not enough emphasis has been placed on understanding the factors considered and the assumptions made by providers in constructing their glide paths. Part of the solution requires increased transparency and communication from target date providers. Manning & Napier continues to maintain that a flexible glide path which incorporates a variety of factors, such as time horizons, contribution rates, withdrawal needs, and prevailing market conditions, provides an investment manager with the opportunity to balance the conflicting goals of capital appreciation and capital preservation throughout the various phases encountered during a participant’s lifetime. As previously illustrated, these factors are the foundation on which the Manning & Napier Glide Range was created.
Manning & Napier’s life cycle offerings include target date (age-based) and lifestyle (risk-based) mutual funds (Manning & Napier Fund, Inc. Target Series and Pro-Blend® Series) and affiliate collective investment trust (CIT) funds (Manning & Napier Pro-Mix® CIT Funds, Retirement Target CIT Funds, and GOALSM CIT Funds).
Because life cycle funds invest in both stocks and bonds, the value of your investment will fluctuate in response to stock market movements and changes in interest rates. Investing in life cycle funds also involves a number of other risks, including issuer-specific risk, foreign investment risk, and small-cap/mid-cap risk as the underlying investments change over time. Additionally, some target date funds invest in other funds and therefore, may have additional risks associated with the underlying funds. Principal value is not guaranteed at any time, including at the target date (the approximate year when an investor plans to stop contributions and start periodic withdrawals).
For more information about any of the Manning & Napier Fund, Inc. Series, you may obtain a prospectus at www.manning-napier.com or by calling (800) 466-3863. Before investing, carefully consider the objectives, risks, charges and expenses of the investment and read the prospectus carefully as it contains this and other information about the investment company.
Manning & Napier Advisors, LLC provides investment advisory services to Exeter Trust Company (ETC), Trustee of the Manning & Napier Collective Investment Trust funds. The Collectives are available only for use within certain qualified employee benefit plans. The Manning & Napier Fund, Inc. is managed by Manning & Napier Advisors, LLC. Manning & Napier Investor Services, Inc., an affiliate of Manning & Napier Advisors, LLC and ETC, is the distributor of the Fund shares.
1Source: Outcomes of Participant Investment Strategies 1997–2006, a study conducted by Burgess + Associates for John Hancock USA examining the performance of portfolios of 14,485 (ten yr) and 200,467 (five yr) retirement plan participants contributing to their employer’s defined contribution plans through an ARA group annuity contract issued by John Hancock USA.
2Source: Gary Brinson, Brian Singer, and Gilbert Beebower, “Determinants of Portfolio Performance II, An Update”, May–June 1991 issue of Financial Analysts Journal
3Dolvin, Templeton, and Rieber, “Asset Allocation for Retirement: Simple Heuristics and Target-Date Funds”, Journal of Financial Planning March 2010
4National Vital Statistics Reports, Vol. 58, No. 21: United States Life Tables, 2006
555rd Annual Survey of Profit Sharing and 401(k) Plans by the Profit sharing/401(k) Council of America
6The same assumptions disclosed in Table 1 were utilized. In addition, it was assumed that the participant’s portfolio continues to earn a 7% annual return throughout retirement and an initial withdrawal of $1,500 (6% initial annual withdrawal rate) is taken on an inflation-adjusted quarterly basis thereafter.