
In his capacity as Managing Director of Fixed Income, Marc and his team manage the implementation of our Fixed Income processes and frameworks for both multi-asset and fixed income specific strategies. In addition, Marc is a member of the Investment Policy Group, responsible for our economic and market overviews and asset allocation decision making. He oversees the firm’s core, high yield, and nontraditional fixed income strategies, brings over 20 years of industry experience, with 16 of those at Manning & Napier.
The economic data have softened this summer, while inflation has remained painfully high. Not exactly a great setup for investors. As economists monitor the whims of the latest inflation reading, markets have begun reacting schizophrenically. The everything sell off through June was replaced by an everything rally in July/early August—leading to the dreaded psychology of FOMO (fear of missing out)—only to be replaced by fresh weaknesses early this fall.
On the back of all this choppiness, one of the most frequent questions our clients are asking is: Should we be buying high yield?
Of course, any answer should be taken in the context of the end client’s specific goals and objectives, but in general, there are 3 key questions we suggest financial professionals ask themselves when considering high yield.
- Have you already implemented high yield as an asset class?
- We view high yield as an attractive strategic allocation decision within traditional balanced portfolios (i.e., 60/40), as they improve returns while lowering volatility over longer horizons
- Do you have a perspective on how high yield may perform over the intermediate- to long- term?
- Due to recent inflections in a number of structural market and economic forces, and when paired with the evolving thematic views of our Fixed Income Group, we view shorter duration, higher yielding asset classes, such as high yield, as best positioned to generate returns over the coming decade.
- When does a fresh allocation make sense?
- Tactically and over the very short-term, we are more cautious on high yield, due to elevated valuations at this stage of the economic cycle. However, markets move quickly, and we believe financial professionals should begin building their shopping lists right now for when a better entry point eventually arrives.
Before we dig deeper on each of the above, let’s talk about the role high yield is playing in how we are positioning our client portfolios.
For multi-asset class portfolios, and for fixed income strategies that allow high yield, we are positioned at the lower end of ranges. Despite short-term concerns, we want our clients to maintain some exposure due to the long-term attractiveness of the asset class. Should spreads widen, we will likely add to high yield allocations, and swiftly so. For content, spreads above 750 basis points would suggest to us that the time is now to add aggressively, and at 1000 basis point spread levels—which we view as recessionary levels—we would be ‘all in’ at the higher end of allowable ranges.
1. The case for a strategic allocation to high yield…
Adding high yield to both balanced and aggregate fixed income portfolios has historically increased returns and decreased volatility. The key variables have been the excess credit spread and liquidity premium offered to investors by the high yield asset class. In thinking about how high yield fits into portfolios as a complementary piece, it has both equity-like and fixed income-like features, but with a correlation that has been historically higher to equities.
When looking at the data, it shows that high yield has a higher Sharpe ratio—on par with 60/40— than other fixed income sectors and equities. Additionally, using high yield as a complement to traditional fixed income and balanced portfolios has historically added returns while reducing risk.
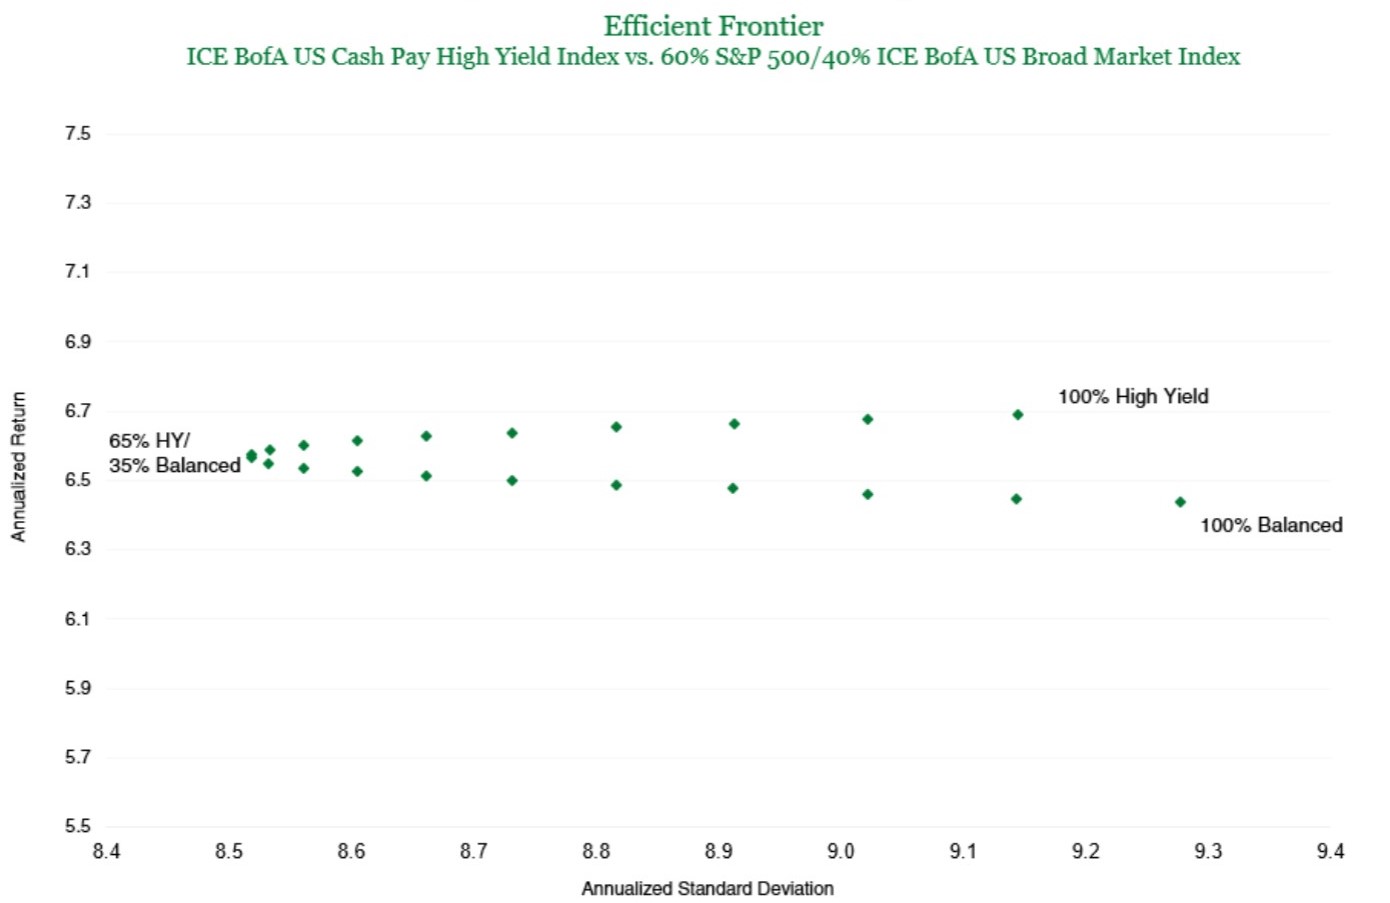
Source: Bloomberg. (12/31/1996 - 08/31/2022).
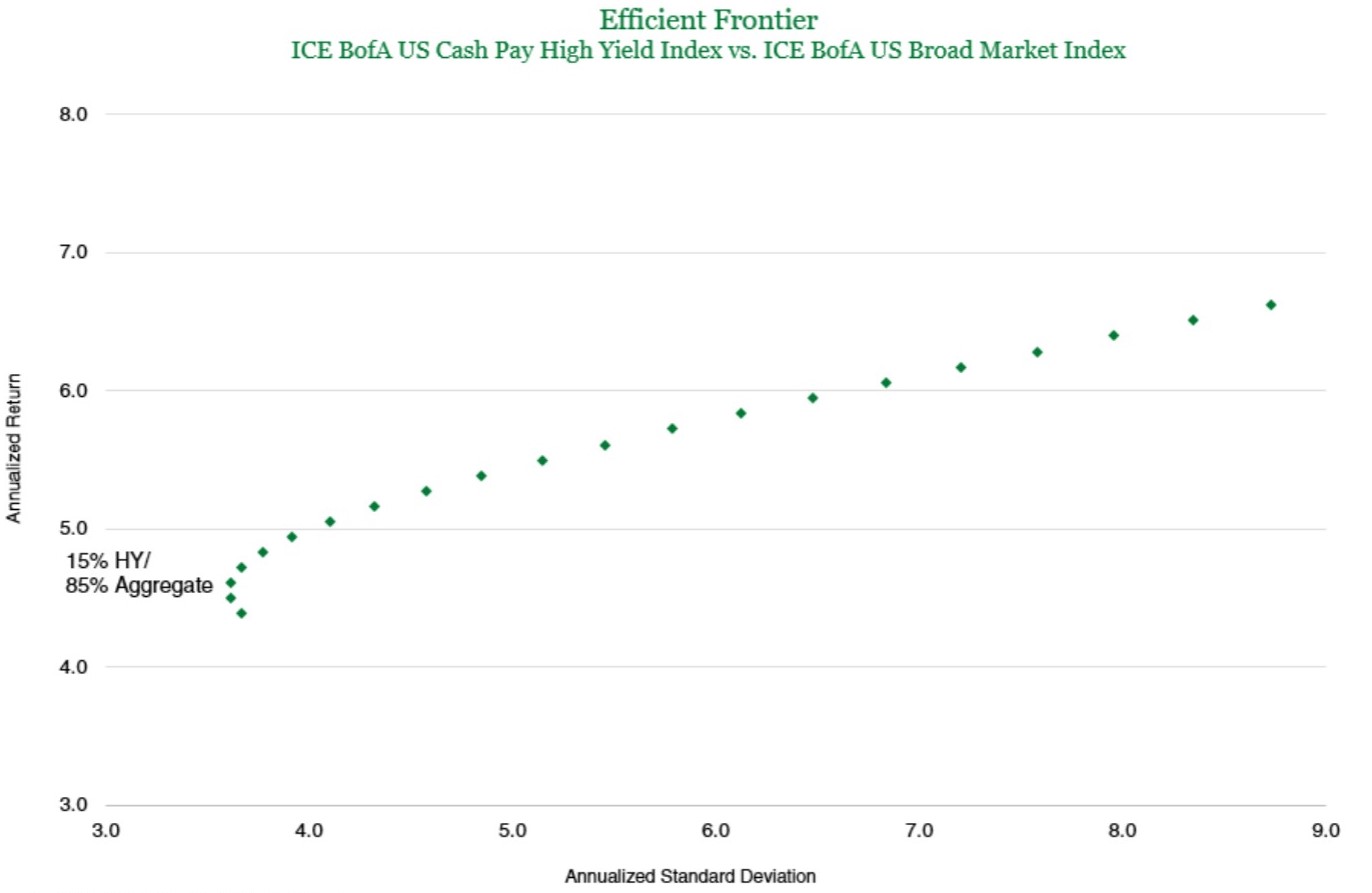
Source: Bloomberg. (12/31/1996 - 08/31/2022).
For balanced portfolios, returns are in a very narrow band, but the addition of high yield materially improves risk metrics. The efficient frontier over the time frame shown (12/31/1996 to 08/31/2022) would argue for a portfolio mostly comprised of high yield (65%) and modest allocation to equities (21%) and traditional fixed income (14%). We utilize a much more modest range of 0-10% for our traditional multi-asset class portfolios and 0-20% for our income oriented multi-asset class portfolios because we can also incorporate additional asset classes (i.e., real estate).
2. We believe that structural shifts favor short duration high yielding assets, such as high yield bonds, over the next decade.
When we assess the longer-term structural factors that drive economies and markets, we believe several of them have inflected. They argue, on net, that the multi-decade trend of falling inflation and interest rates has likely ended. Here are some of the most significant reasons why:
Demographics have shifted in the United States, even as they remain poor across much of the developed world (i.e., China, Japan, and Europe). An aging population is often viewed as disinflationary due to the lower level of consumption; we would note that young and elderly people consume but do not produce (Demand > Supply). Additionally, as a population ages, its higher productivity workers are retiring. We view both of these forces as inflationary.
De-globalization has accelerated. Disinflation and low interest rates have benefitted from globalization over the last several decades, and we believe this has inflected on several different fronts. First, the tailwinds from the influx of low-cost labor into the global economy from China, as well as Eastern Europe due to the falling of the Berlin wall, are behind us. Second, geo-political rivalries have inflected higher. Lastly, supply chains are shifting from lowest cost, just-in-time to near-sourcing, friendly-sourcing, and just-in-case.
Policy implementation has become easier (i.e., inflationary) both on the monetary and fiscal fronts. We have gone from cutting interest rates, to cutting interest rates plus quantitative easing, to cutting interest rates plus quantitative easing plus fiscal support—aka. some form of MMT-lite. Additionally, in response to the persistently low and falling inflation over the past decade or so, central banks, including the Federal Reserve, have shifted their focus to more permissive policy constructs, such as average inflation targeting.
Populism has been related to and a driver of the other issues mentioned. Additionally, it will impact areas such as anti-trust law, government social spending decisions, etc.
Debt levels also remain elevated, globally. And while the debt is concentrated in the government sector, with consumers and corporations holding up okay in relatively healthy conditions, this still remains a slower growth, lower inflation driver.
A key thematic view of our Fixed Income Group at Manning & Napier is that the global economy is ‘short everything’ in the 2020s, driven by a decade of underinvestment. Working backwards, the 2000s gave us a debt driven supercycle, in which there was overinvestment across the board. This was followed by the 2010s, a decade characterized by an overhang from the 2000s investment spree and which led to slower economic growth, globally. In this environment, companies focused on financial engineering, prioritizing shareholder returns over capital spending. Now in the 2020s, this has left us ’short everything’, including housing, commodities and manufacturing.
We believe that both the inflection of key secular drivers and our ‘short everything’ investment theme will lead to higher highs and higher lows for inflation and interest rates over the next decade. We believe this backdrop will favor shorter duration, higher yielding assets such as high yield bonds (aka. below investment-grade debt). Cash received today becomes more valuable than cash received in the future, a flip of the dynamics that drove investing returns during the slow growth 2010s.
Our cyclical/tactical outlook on high yield (and risk assets broadly) is more cautious
In an environment such as the one we are in today, point forecasting and market timing can be treacherous at best. Market narratives shift on a seemingly weekly, if not daily basis, with each new batch of data changing the mood.
How can financial professionals avoid chasing the market – buying high and selling low – without missing out on the next leg up? We believe the answer is in having macroeconomic discipline.
We use a Through the Cycle Methodology in assessing top-down positioning (i.e., sectors, duration, yield curve, etc.), helping us maintain discipline and focus on the big picture of where we are in the cycle, and not on the next 10-20 basis point (bp) move in interest rates or credit spreads. The methodology allows us to pay attention to what we should be doing and, equally importantly, the
things that we should not be doing.
We believe, in general, that the global macroeconomy is late in its economic cycle, with central banks aggressively tightening monetary policy to curb very high levels of inflation. Central banks are focused on inflation fighting and are actively taking on recession risk, both to keep longer term inflation expectations in check and to rebuild their credibility.
In addition, we believe that a deteriorating global growth outlook, combined with tightening liquidity conditions, presents a cautious environment for risk assets (i.e., credit). In our opinion, the credit markets have not re-priced to adequately reflect this more challenging outlook. For example:
- The tights for high yield spreads were in the ~300bp context and recessionary pricing is >1000bp.
- Spreads are currently ~450bp. We do not view this as an attractive entry point in a deteriorating liquidity and growth environment.
What would make us more constructive on high yield from here?
- Conditions: increased slack in the economy, leading the Fed to begin cutting interest rates, leading to improved liquidity and financial conditions.
- Pricing: We would look for spreads to widen out to the 750bp+ region.
- At that level, the forward return expectations would be very attractive.
- High Yield could cheapen further from there, but any potential selloff and recovery would likely be relatively quick, making the short-term pain worthwhile versus the potential of missing out on large risk premiums. This dynamic can be seen in the below scatter plot of starting spreads against forward returns.
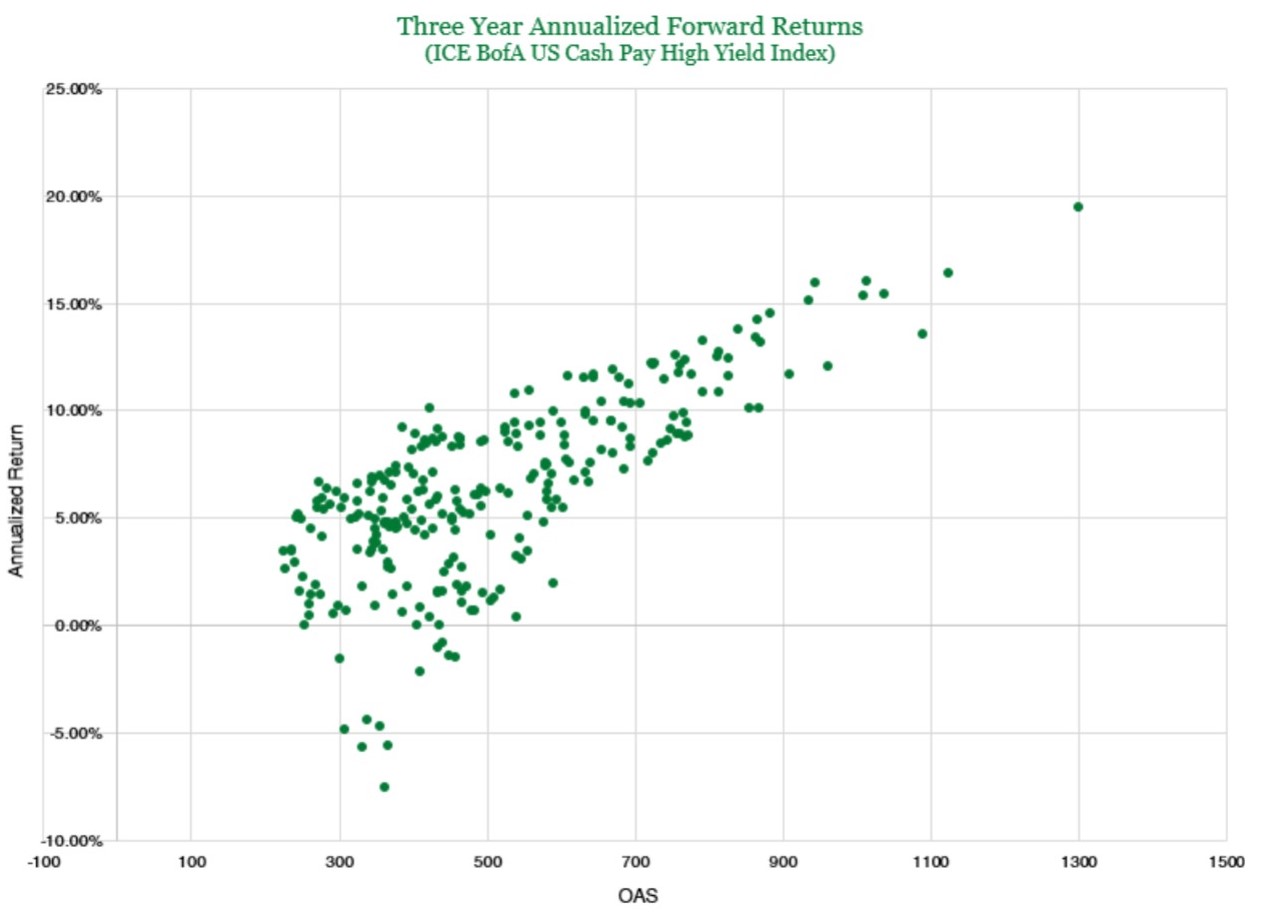
Source: Bloomberg. (12/31/1996 - 08/31/2022).
Given our more challenging view on the economic and liquidity conditions facing investors today, we believe having a thorough understanding of the specific high yield strategy you are implementing is crucial. We believe strategies with downside protection built into their processes and a focus on alpha generation will be well positioned going forward. Conversely, strategies that have large exposures to lower quality issues (e.g., CCC bucket), or those focused on the largest most liquid issues (e.g., ETFs or indexes), may have a more challenging go of it, in our opinion.
Our research team continues to monitor these topics and more. If you’re interested in hearing more of our monitoring points and views on an array of investing themes, then subscribe to our insights.
This material contains the opinions of Manning & Napier Advisors, LLC, which are subject to change based on evolving market and economic conditions. This material has been distributed for informational purposes only and should not be considered as investment advice or a recommendation of any particular security, strategy, or investment product.
The Intercontinental Exchange (ICE) Bank of America (BofA) U.S. Cash Pay High Yield Index tracks the performance of U.S. dollar denominated below investment grade corporate debt, currently in a coupon paying period, issued in the U.S. domestic market. Qualifying securities must have at least one year remaining term to final maturity as of the rebalancing date, at least 18 months to final maturity at the time of issuance, a fixed coupon schedule, and a minimum amount outstanding of $250 million. The Index returns do not reflect any fees or expenses. Index returns provided by Intercontinental Exchange (ICE). Index data referenced herein is the property of ICE Data Indices, LLC, its affiliates ("ICE Data") and/or its third party suppliers and has been licensed for use by Manning & Napier. ICE Data and its third party suppliers accept no liability in connection with its use. Data provided is not a representation or warranty, express or implied, as to the ability of any index to accurately represent the asset class or market sector that it purports to represent and none of these parties shall have any liability for any errors, omissions, or interruptions of any index or the data included therein. For additional disclosure information, please see: https://go.manning-napier.com/benchmark-provisions.
The S&P 500 Total Return Index is an unmanaged, capitalization-weighted measure comprised of 500 leading U.S. companies to gauge U.S. large cap equities. The Index returns do not reflect any fees or expenses. The index accounts for the reinvestment of regular cash dividends, but not for the withholding of taxes. Index returns provided by Bloomberg. Index data referenced herein is the property of S&P Dow Jones Indices LLC, a division of S&P Global Inc., its affiliates ("S&P") and/or its third party suppliers and has been licensed for use by Manning & Napier. S&P and its third party suppliers accept no liability in connection with its use. Data provided is not a representation or warranty, express or implied, as to the ability of any index to accurately represent the asset class or market sector that it purports to represent and none of these parties shall have any liability for any errors, omissions, or interruptions of any index or the data included therein. For additional disclosure information, please see: https://go.manning-napier.com/benchmark-provisions.
The ICE BofA US Broad Market Index is an unmanaged, market-value weighted index of U.S. domestic investment-grade debt issues, including government, corporate, asset-backed, and mortgage-backed securities, with maturities of one year or more. Index returns do not reflect any fees or expenses. Index returns provided by Intercontinental Exchange (ICE). Index data referenced herein is the property of Bloomberg Finance L.P. and its affiliates ("Bloomberg"), and/or its third party suppliers and has been licensed for use by Manning & Napier. Bloomberg and its third party suppliers accept no liability in connection with its use. Data provided is not a representation or warranty, express or implied, as to the ability of any index to accurately represent the asset class or market sector that it purports to represent and none of these parties shall have any liability for any errors, omissions, or interruptions of any index or the data included therein. For additional disclosure information, please see: https://go.manning-napier.com/benchmark-provisions.