
Last week, the latest US fiscal stimulus was signed into law, delivering $1.9 trillion of aid to a wide range of people and groups, as well as other non-COVID related spending.
And at the same time, financial markets have continued evolving, but in a different way than in the past. Growth-style equities have been taking a beating as of late as investors reallocate to cyclicals, small-caps, and other stocks that could be considered as value style.
We view these events as clearly related, and they both describe the importance of expectations in today’s highly dynamic market environment.
Another Round of Stimulus
We know from the prior two COVID aid bills that direct aid can make a substantial economic impact. And by direct aid, we mean literally cutting checks and giving them to people. Right or wrong, handing people money softened the blow of mass unemployment during last year’s rolling economic shutdowns.
The aid also led to two simultaneous economic changes for consumers: They are both spending more and saving more. If people need the money today, they have it and can spend it. And those fortunate enough to not need it, can save it. Long-term consequences notwithstanding, the near-term benefits from increased spending, and potential intermediate-term benefits of saving are huge. There is clearly a lot of pent-up demand waiting to be unleashed in the economy.
The latest stimulus bill, as well as other factors such as falling COVID rates, vaccines, and economic reopening, are starting to make a GDP difference. From the end of last year and through last week’s bill signing, Wall Street expectations for Q1 GDP growth have doubled, from its usual low 2% rate to the mid-4% range. Some economists are speculating that US contribution to global growth could approach or surpass China’s for the first time in over a decade. Economic growth expectations are clearly rising.
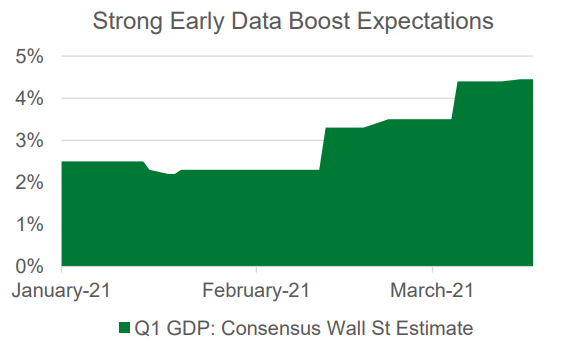
Source: Bloomberg (01/01/2021 – 03/17/2021).
On the surface, you might expect the market to respond to this step change in economic fundamentals with a step change of its own, but that isn’t the case. Year-to-date as of the market close on Friday, March 12, the S&P 500 Index is up 5%. Not bad, but not off to the races.
From Growth to Small-Caps and Value
While the broader market has only moved modestly as a whole, there are much more substantial changes unfolding under the surface. And these changes seem to be directly related to rising economic expectations.
The Dow Jones Industrial Average and Russell 2000 are each up 8% and 19% year-to-date, respectively, better than the broader S&P 500, and substantially better than the tech-heavy Nasdaq Index, up just 3% this year. This reversal closely follows the Nasdaq’s stunning rise in recent years. Growth is being shunned in a manner we haven’t seen in quite some time.
But the weakness isn’t limited to tech specifically. Growth equities broadly are seeing increased selling pressure regardless of sector. The chart below calls direct attention to the style shift, highlighting the dramatic performance swing from the growth- to value-style between last year and today. It should be recognized that the year-to-date results are as of mid-March, not yet one full quarter into the year.
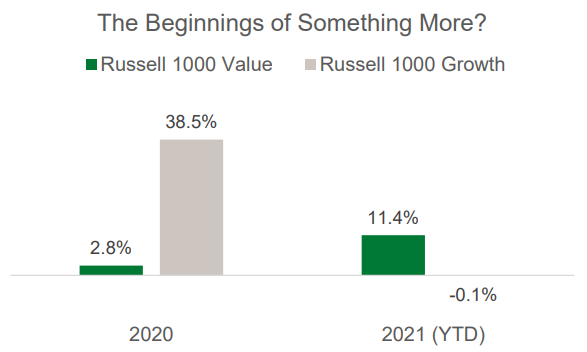
Source: Morningstar (01/01/2021 – 03/15/2021).
This sharp market rotation is prompting the obvious question, how much wider can this performance gap become?
This is why context matters, and it is why perspective from the past decade is so helpful. Since the start of 2010, growth-style equities outperformed the value-style over 5% annualized from 2010 through March 15, 2021, for a cumulative performance gap of over 225%. While this is an overly simplistic analysis, it does show how much further value may still have to run.
Not One Extreme or the Other
We believe the swing away from all-growth, all the time is here to stay, but aren’t ready to call value the winner yet either. We think that today’s environment is about growth and value, and we see opportunity in both.
Economic expectations are clearly rising, benefiting cyclicals and other value-style securities, but many growth-oriented businesses are truly disruptive enterprises that should not be overlooked. We disagree with those who suggest investors should be diving in and out of one style or another wholesale. In our view, valuations are, as always, key. And all of our investment strategies consider valuation in every investment they make.
You can learn more about some of the specific opportunities we like in both growth and value in our recent blogs on animal health and payment processors, as well as on gold miners and more.
Enjoying this information? Sign up to have new insights delivered directly to your inbox.
This material contains the opinions of Manning & Napier Advisors, LLC, which are subject to change based on evolving market and economic conditions. This material has been distributed for informational purposes only and should not be considered as investment advice or a recommendation of any particular security, strategy, or investment product. The reader should not assume that investments in the securities identified and discussed were or will be profitable.
The Dow Jones Industrial Average is a price-weighted average of 30 blue-chip U.S. stocks that are generally the leaders in their industry. Dividends are reinvested to reflect the actual performance of the underlying securities. The Index returns do not reflect any fees or expenses. Index returns provided by Morningstar.
The NASDAQ Composite Index is a broad-based capitalization-weighted index of domestic and international based common type stocks listed in all three NASDAQ tiers: Global Select, Global Market and Capital Market. The NASDAQ Composite includes over 3,000 companies. The Index returns do not reflect any fees or expenses. Index returns provided by Morningstar.
The S&P 500 Index is an unmanaged, capitalization-weighted measure comprised of 500 leading U.S. companies to gauge U.S. large cap equities. The Index returns do not reflect any fees or expenses. Dividends are accounted for on a monthly basis. Index returns provided by Morningstar. S&P Dow Jones Indices LLC, a division of S&P Global Inc., is the publisher of various index based data products and services, certain of which have been licensed for use to Manning & Napier. All such content Copyright © 2021 by S&P Dow Jones Indices LLC and/or its affiliates. All rights reserved. Data provided is not a representation or warranty, express or implied, as to the ability of any index to accurately represent the asset class or market sector that it purports to represent and none of these parties shall have any liability for any errors, omissions, or interruptions of any index or the data included therein.
The Russell 2000® Index is an unmanaged index that consists of 2,000 U.S. small-capitalization stocks. The Index returns are based on a market capitalization-weighted average of relative price changes of the component stocks plus dividends whose reinvestments are compounded daily. The Index returns do not reflect any fees or expenses. Index returns provided by Morningstar.
The Russell 1000® Growth Index is an unmanaged, market capitalization-weighted index consisting of those Russell 1000® Index companies with higher price-to-book ratios and higher forecasted growth values. The Index returns are based on a market capitalization-weighted average of relative price changes of the component stocks plus dividends whose reinvestments are compounded daily. The Index returns do not reflect any fees or expenses. Index returns provided by Morningstar.
The Russell 1000® Value Index is an unmanaged, market capitalization-weighted index consisting of those Russell 1000® Index companies with lower price-to-book ratios and lower forecasted growth values. The Index returns are based on a market capitalization-weighted average of relative price changes of the component stocks plus dividends whose reinvestments are compounded daily. The Index returns do not reflect any fees or expenses. Index returns provided by Morningstar.
©2021 Morningstar, Inc. All rights reserved. Morningstar, Inc. is a global investment research firm providing data, information, and analysis of stocks and mutual funds. The information contained herein: (1) is proprietary to Morningstar and/or its content providers; (2) may not be copied, adapted or distributed; and (3) is not warranted to be accurate, complete or timely. Neither Morningstar nor its content providers are responsible for any damages or losses arising from any use of this information, except where such damages or losses cannot be limited or excluded by law in your jurisdiction. Past financial performance is no guarantee of future results.