
In investing, there’s no limit to how high a stock can go. Worst case, a stock can go off the board (i.e., to zero), and you’ll lose what you put in. But best case, a stock can go up 2x, 5x, 10x or more, delivering massive gains to the long-term investor.
This wide range of outcomes is the exact reason for diversifying. Diversification can provide long-term benefits by reducing overexposure to any one particular asset. Yes, splitting up your holdings into dozens of smaller investments may reduce the opportunity to make big gains, but it will also reduce your likelihood of significant losses.
This is a welcome tradeoff as long-term growth that compounds over time is the ultimate goal – and a more reliable way to achieve your objectives. You can see the benefits looking back at history, not only across specific stocks, but even large asset classes.
Looking back since the year 2000, below, we visualized the annual returns of eight of the broadest financial market asset classes. The results jump off the page. Which is to say, the winners became losers, and the losers became winners, and back again, seemingly at random, from each year to the next.
The Quilt of Financial Market Returns
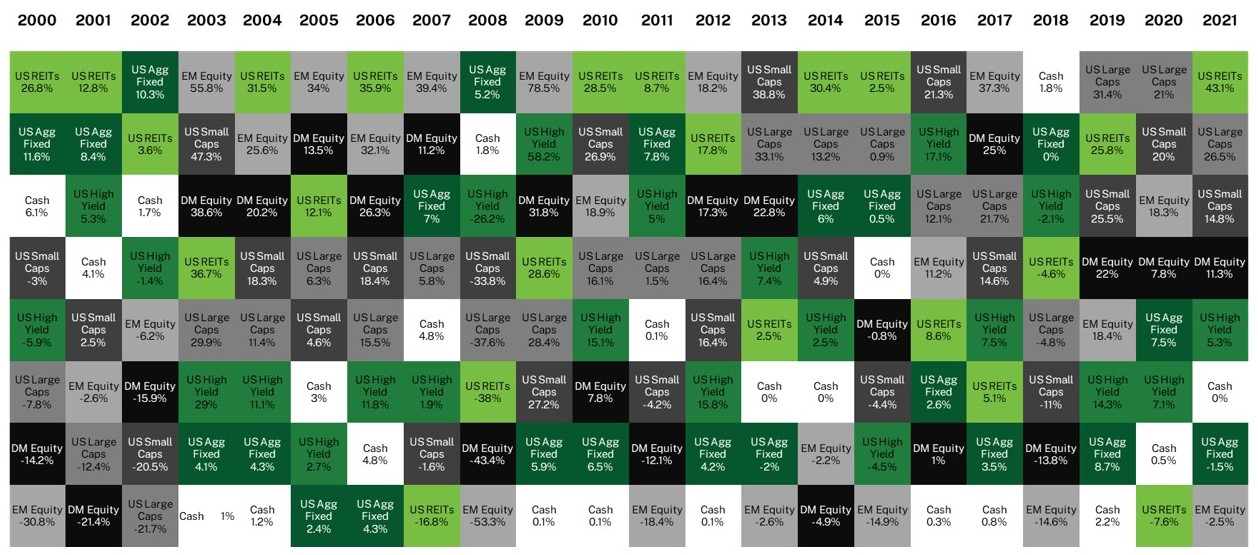
Source: Bloomberg (12/2000 – 12/2021). Analysis by Manning & Napier. Please Note that diversification does not assure a profit or protect against loss in a declining market.
Less Volatility, Better Results
The benefits of diversification go beyond simply minimizing your risk to any single position. A well-balanced portfolio across various uncorrelated asset classes can provide a few other benefits.
When building portfolios, it is optimal to have assets that are different, or in investment speak, uncorrelated. This means that when one rises, the other is likely to fall. Traditionally, stocks and bonds are uncorrelated, which is why they are viewed as the foundational building blocks of portfolios. When stocks fall, bonds usually rise. This stabilizes your portfolio, helping it be more resilient in down markets.
In addition, more stable portfolios deliver better returns than more volatile portfolios (aka. volatility drag), and it’s not a hunch or a theory, it’s simple math. If a portfolio goes up 8% in one year and 8% the next, versus down 2% and up 18%—note they both add to 16% total—the more stable portfolio will deliver better results (see below visual). The return difference of $100 amounts to a full 1% of the original $10,000 investment, and it does so after just two years! Adding extra percentage points of return on top of the long-term power of compounding can make a sizeable performance difference over time.
|
Stable |
Volatile |
|
|
Year 0 |
$10,000 |
$10,000 |
|
Returns |
8% |
-2% |
|
Year 1 |
$10,800 |
$9,800 |
|
Returns |
8% |
18% |
|
Year 2 |
$11,664 |
$11,564 |
For illustrative purposes only. Analysis: Manning & Napier.
Conclusion
Everyone knows someone who ‘hit it big’ on an investment. But for every person talking about their big winner, there’s dozens more who put too much into one investment with a much worse result. While it may seem like the grass is always greener on the other side, putting all your eggs in one basket does more harm than good. If you ever feel like you’re on the wrong path – stay patient, stay the course, and talk with your financial consultant about stress testing your plan to see your options.
We're here to help
We're always available if you'd like to schedule a call with a member of our team to talk about the current environment, solutions we offer, or other questions top of mind for you.
Schedule a callThis material contains the opinions of Manning & Napier Advisors, LLC, which are subject to change based on evolving market and economic conditions. This material has been distributed for informational purposes only and should not be considered as investment advice or a recommendation of any particular security, strategy, or investment product. The reader should not assume that investments in the securities identified and discussed were or will be profitable.
US Large Caps is represented by the Russell 1000® Index is an unmanaged index that consists of 1,000 large-capitalization U.S. stocks. The Index returns are based on a market capitalization-weighted average of relative price changes of the component stocks plus dividends whose reinvestments are compounded daily. The Index returns do not reflect any fees or expenses. Index returns provided by Bloomberg. Index returns provided by Bloomberg.
US Small Caps is represented by the Russell 2000® Index which is an unmanaged index that consists of 2,000 U.S. small-capitalization stocks. The Index returns are based on a market capitalization-weighted average of relative price changes of the component stocks plus dividends whose reinvestments are compounded daily. The Index returns do not reflect anyfees or expenses. Index returns provided by Bloomberg.
DM Equity is represented by the MSCI EAFE Index (EAFE) which is a free float-adjusted market capitalization index designed to measure large and mid-cap representation across 21 Developed Markets countries (excluding the U.S. and Canada). The Index returns do not reflect any fees or expenses. The Index is denominated in U.S. dollars. The Index returns are net of withholding taxes. They assume daily reinvestment of net dividends thus accounting for any applicable dividend taxation. Index returns provided by Intercontinental Exchange (ICE).
EM Equity is represented by the MSCI Emerging Markets Index (MSCI EM) which is a free float-adjusted market capitalization indexdesigned to measure large and mid-cap representation across 24 Emerging Markets countries. The Index returns do not reflect any fees, expenses, or reinvestment of dividends. The Index is denominated in U.S. dollars. The Index returns are net of withholding taxes. They assume daily reinvestment of net dividends thus accounting for any applicable dividend taxation. Index returns provided by Bloomberg.
US Agg Fixed is represented by the Bloomberg U.S. Aggregate Bond Index is an unmanaged, market-value weighted index of U.S. domestic investment-grade debt issues, including government, corporate, asset-backed, and mortgage-backed securities, with maturities of one year or more. Index returns do not reflect any fees or expenses. Index returns provided by Intercontinental Exchange (ICE).
US REITs is represented by the MSCI U.S. Real Estate Investment Trust (REIT) Index which is a free float-adjusted market capitalization index that is comprised of equity REITs that are classified in the Equity REITs Industry under the GICS® Real Estate sector. The MSCI U.S. REIT Index is a subset of the MSCI USA Investable Market Index (IMI) which captures large, mid, and small-cap securities.
Index returns do not reflect any fees or expenses. Index data referenced herein is the property of each index sponsor (LondonStock Exchange Group plc and its group undertakings (Russell), MSCI, and Bloomberg), their affiliates (“Index Sponsors”) and/or their third partysuppliers and has been licensed for use by Manning & Napier. The Index Sponsors and their third partysuppliers accept no liability in connection with its use. Data provided is not a representation or warranty, express or implied, as to the ability of any index to accurately represent the asset class or market sector that itpurports to represent and none of these parties shall have any liability for any errors, omissions, or interruptions of any index or the data included therein. For additional disclosure information, please see: https://go.manning-napier.com/benchmark-provisions.
US High Yield is represented by the Bloomberg U.S. Corporate High Yield Bond Index which measures the USD-denominated, high yield, fixed-rate corporate bond market. Securities are classified as high yield if the middle rating of Moody’s, Fitch and S&P is Ba1/BB+/BB+ or below. Bonds from issuers with an emerging markets country of risk, based on Bloomberg EM country definition, are excluded.
Cash is represented by the Bloomberg U.S. Short Treasury Index which measures the performance of the U.S. Treasury bills, notes, and bonds under 1 year to maturity.