
Executive Summary
- Inflation is rising, and we expect it to continue rising in the near-term
- We believe these above-trend price increases will be relatively short-lived as the economy works through a variety of transitory issues
- Long-term structural forces should continue to keep inflation in check, but monetary and fiscal policy decisions loom large over this outlook
Inflation was considered dead and buried in the US for decades, and many have been wondering what it would take to resuscitate the beast. Well it should come as no surprise that after the largest fiscal spending program in the history of the US, combined with extraordinarily easy monetary policy programs, investors would eventually become concerned about inflation again.
Anxieties have been gradually building since the stimulus programs were first approved a year ago, but there was not yet a lot of evidence of significant inflation. The most recent report on inflation in April, however, showed a 4.2% year-over-year increase in the Consumer Price Index (CPI), the highest rate in over a decade. This release certainly grabbed the attention of investors, taking center stage as ’the biggest tail risk’ to the markets based on one recent survey of fund managers.
The sharp rise in inflation should have been, at least in our view, reasonably anticipated by investors for several short-term reasons. We’ll get to those reasons in a moment, but for us, the real question investors should be asking themselves is whether the US economy has entered an entirely new regime, one with structurally higher long-term inflation ahead.
Transitory vs. Structural Inflation Drivers
In the months ahead, we expect nearly every inflation indicator to report higher prices than consumers and business owners are accustomed to. Yet, we also expect these above-trend price increases to be relatively short-lived, reflecting a variety of factors, including: easy year-over-year comparisons, which are based off an extreme time period a year ago that will eventually fade; a rise in commodity prices from artificial pandemic lows and their bullwhip effect on supply chains (e.g., lumber and semiconductors); and a surge in demand in select areas, including hotels, airlines, used cars, car rentals, etc., as the economy reopens.
Additionally, recent headlines about labor shortages in the hospitality, leisure, and restaurant sectors, among others, are leading to higher starting wages and benefits, further juicing inflation fears. We view this as a one-time event and believe wages will stabilize at these levels without leading to sustained year-over-year increases. Many business owners will be unwilling or unable to pass through 100% of this cost increase, resulting in lower profit margins for owners.
Once the economy works through these transitory factors, we expect inflation to revert toward its pre-pandemic, muted trend. We believe the long-term secular forces holding down inflation remain intact, namely demographics, globalization and technology, the decline in labor bargaining power, and a broader distribution of commodity networks. With so much of our outlook depending on these major secular factors, we believe it is appropriate to take a closer look at each.
Demographics
The size and age distribution of a population is a very slow-moving trend, but it can be an enormous boon for the economy, as exhibited in the chart below.
The ratio of younger workers (ages 20-39) versus older workers (ages 40-59) helps illustrate some of the prevailing demographic trends over time. These younger workers represent a population cohort in their prime working and spending years versus those still working but no longer spending as much of their income. The youngest of the ‘Baby Boomer’ generation started coming of age and entering their peak spending years in 1970. As demand for everything from cars to housing rose, it put upward pressure on prices.
The ‘echo boom’ of this generation (i.e., ‘Millennials’) is slightly larger in size than their parents, but as a percentage of the total working population, this cohort falls far short in terms of their aggregate impact. In addition, the lingering impacts of the Global Financial Crisis have continued to dampen the spending and household formation patterns of this generation. While the projected slight increase in demographic ratio, combined with pent-up demand from delayed spending and the COVID crisis, may result in increased spending over the next several years, we believe it lacks the type of demographic spending boom that fueled some of the price increases during the 1970s.
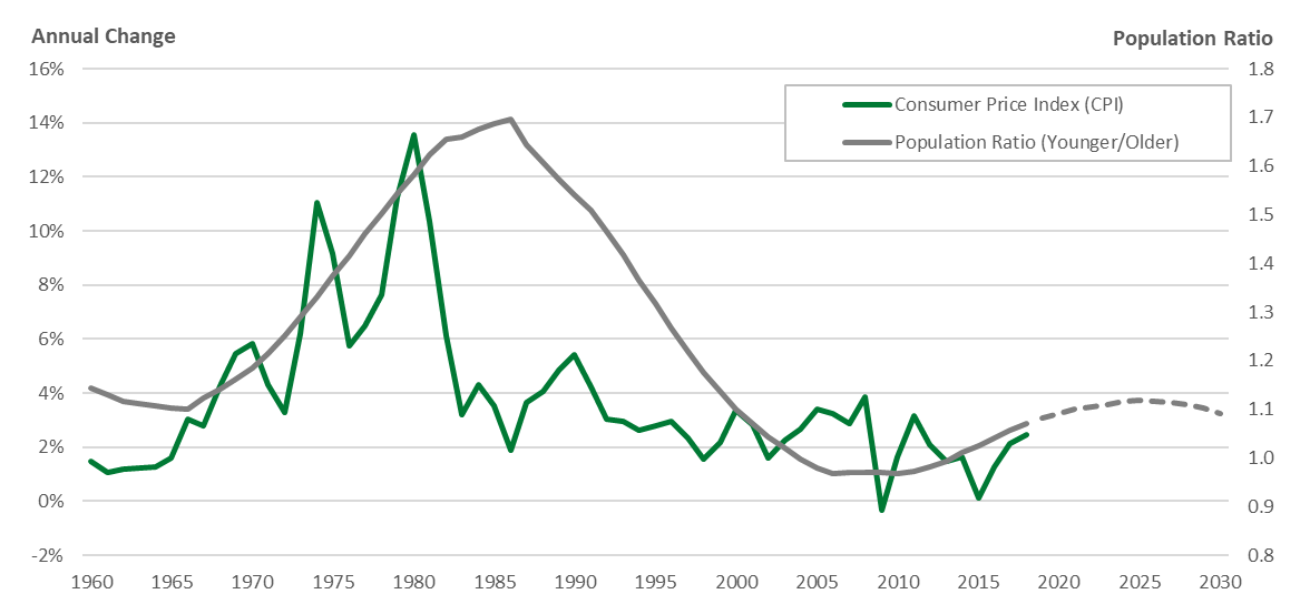
Source: OECD (1960 – 2018). Data after 2018 are estimated.
Globalization & Technology
A proliferation of trade agreements has opened new markets across the world with profound impacts on business practices, consumer prices, geopolitical concerns, and much more. As a percentage of all economic activity, trade has more than doubled both here in the US and globally over the past 50 years (see chart below).
During this time, businesses weighed the trade-off between cost efficiency and supply chain reliability, with the former mostly winning. Companies shipped many of their most labor-intensive jobs offshore and adopted the practice of ‘just in time’ inventory management to further cut back on costs. These savings offered relief against pricing pressures for both businesses and consumers.
The global nature of the pandemic, combined with the ongoing risks of intellectual property theft, shipping bottlenecks, and geopolitical tensions, have businesses reconsidering their decision. We haven’t seen much in the way of action at this point, so it remains to be seen whether a ‘reshoring’ of jobs and changes in supply chain or inventory management will actually occur. Moreover, continued advances in technology, particularly in the areas of robotics, automation, and artificial intelligence, should help alleviate any increased costs that might otherwise be incurred with this effort.
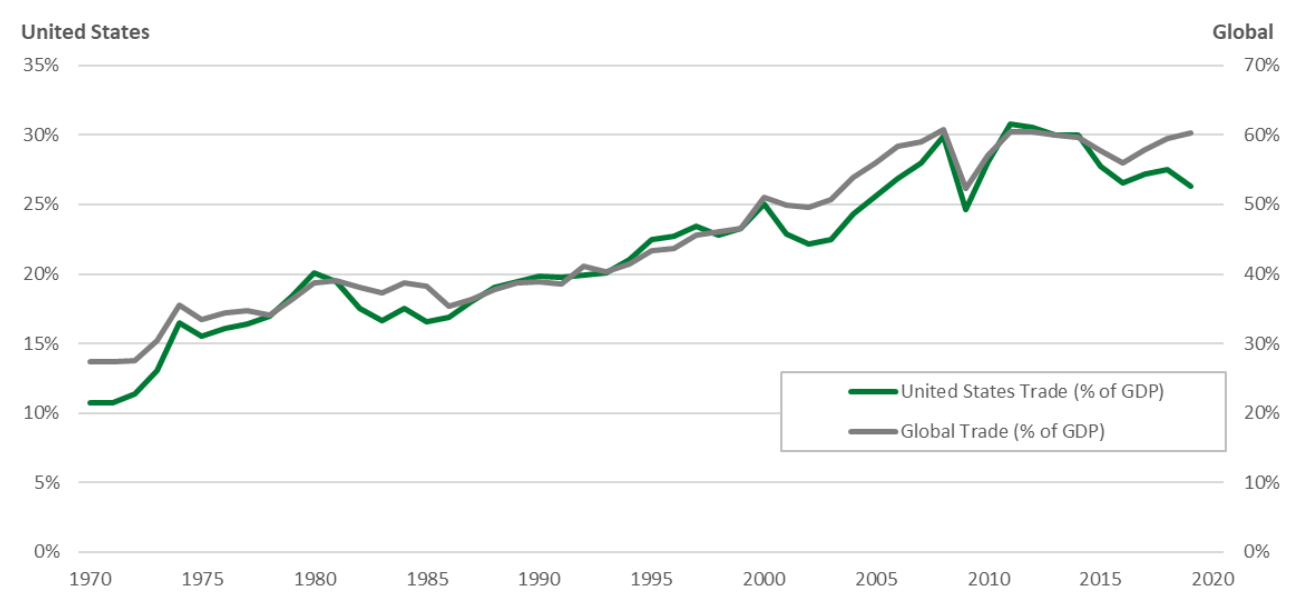
Source: OECD (1970 – 2019).
Labor Bargaining Power
Labor remains the predominant cost for most businesses, although its share has declined over the past several decades as worker productivity gains have grown significantly quicker than wages. As more goods and services are produced with lower levels of labor costs, it reduces the pressure on prices for consumers. A related trend highlighted in the chart below is the decline in union membership amongst workers in the US. The relatively higher percentage of unionized workers in the 1970s created a self-reinforcing cycle between contractual pay increases tied to cost of living increases. This flywheel effect doesn’t exist to nearly the same extent in today’s labor market.
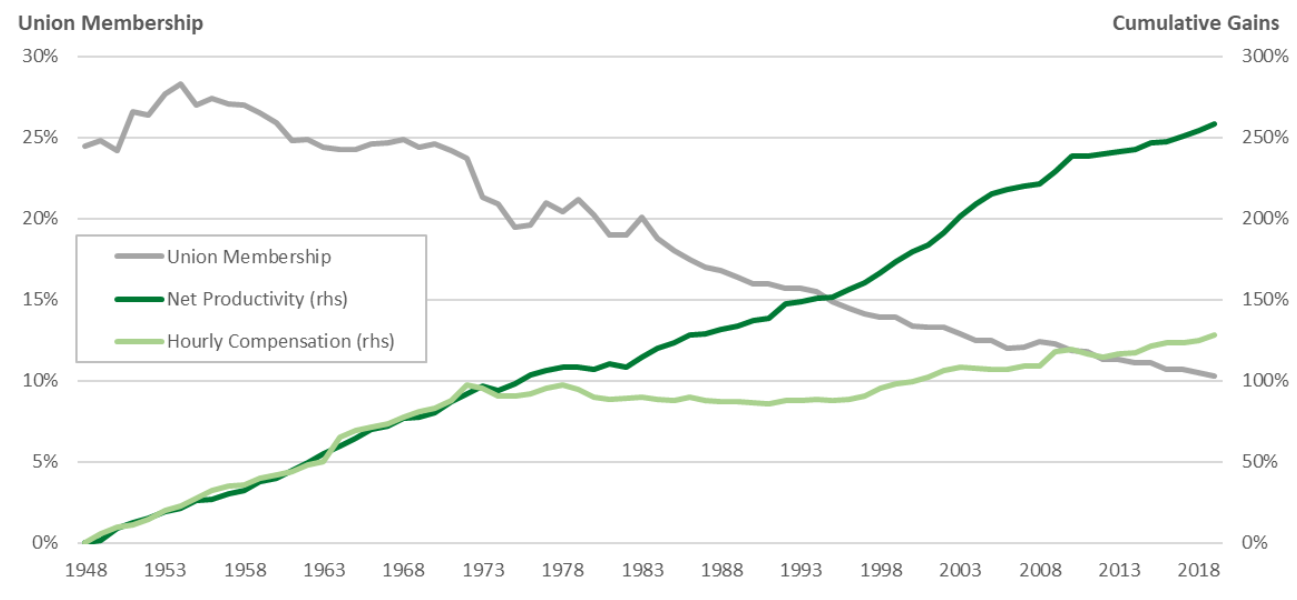
Source: Economic Policy Institute (1948 – 2019).
It’s worth noting the ‘Productivity-Pay Gap’ has become a key focus of the Biden administration, serving as a major talking point for the President’s infrastructure stimulus plan, as well as the recently failed effort to raise the federal minimum wage to $15 per hour. President Biden has also been much more supportive of unions than previous administrations, even seeking to position himself as the most pro-union president since the New Deal1. We think some of the President’s most substantial labor-oriented initiatives are unlikely to become reality given the significant polarization in Congress today, but should some of them pass, it could spark us to adjust our inflation perspective.
Oil and Other Commodities
We can’t discuss the inflationary period of the 1970s without acknowledging the price of oil as a major contributing factor. At the time, the US had recently become a net importer of oil as declining domestic output could no longer keep pace with increasing domestic demand. The Organization of Petroleum Exporting Countries (OPEC) formed during this era as well, seeking to exert its newfound influence on this most important of global commodities.
Members of OPEC announcing an oil embargo in 1973, targeting the US and other countries and leading to the first oil shock. The price of oil, which had traded around $3/barrel in the 1960s, was trading at nearly $40 per barrel in 1980! The US and others learned a painful lesson that stressed the strategic importance of the commodities markets and geopolitics. While not quite fully self-reliant when it comes to crude oil, the US has since become a net exporter of energy, as recently as 2019, for the first time in nearly 70 years, while OPEC’s influence on global oil markets has steadily eroded.
Other commodities have experienced significant price increases in recent years, some even on par with the increase in oil prices during the 1970s. Still, none of these carried as much weight as oil within transportation networks and global supply chains. The geologic nature of certain commodities can lead to geographic concentration issues, but most countries have learned to harness the fleeting benefits of commodity-driven growth by diversifying their economies and playing nice with the major global players.
Lastly, while the period of the 1970s could be described as a supply shock, there are other growth-driven commodity cycles, including the periods of US industrialization in the early 1900s and the rebuilding of Europe and Japan following World War II. The most recent demand-driven cycle, which was also the largest and most compressed of all, was led by China’s industrialization efforts starting in the late 1990s. It’s difficult to imagine another massive development on the scale of China’s efforts happening anytime soon.
Policy Wildcards
In our view, the main risks to our inflation outlook sit squarely with the policymakers, both fiscal and monetary, with fiscal policy being the most impactful. As business activity and consumer spending returns to life, the concern is whether government leaders intend to keep their foot on the gas, pumping further stimulus into an already rapidly heating economy. Historically, this answer would be no, but new polling evidence suggests that recent spending proposals are quite popular, perhaps so much so that political leaders may feel supported or even encouraged to ramp government spending. Political preferences are always morphing and difficult to predict, and polarization will continue hindering the functionality of the government. Directionally, however, the political appetite for big government spending programs seems to be back.
Regarding monetary policy, the Fed has adopted two untested policies in the past 15 years. The first is a massive asset purchase program commonly referred to as quantitative easing (QE), which began in November 2008 and continues to this day. The Fed currently owns nearly $8 trillion in assets and is purchasing securities at a rate of $120 billion per month. The second is an explicit strategy change resulting from the Fed’s monetary policy framework review in August 2020. The central bank elected to change their language on inflation, replacing their previous 2% inflation target with a focus towards achieving inflation that averages 2% over time. This decision effectively permits the Fed to let inflation run higher than target to make up for past shortfalls.
This is where the ‘genie out of the bottle’ or ‘toothpaste back in the tube’ analogies usually come in as many believe it becomes increasingly difficult to tame inflation once it takes hold in an economy. To combat these concerns and gauge its efforts, the Fed commonly references market expectations for inflation. We believe this effort may be counterintuitive as the Fed’s influence on markets and interest rates is already obvious, given the size of its balance sheet and continued presence as a large buyer of fixed income securities.
As we look ahead, the way policymakers apply and unwind these untested, heavily pro-growth policies is key, and the devil will be in the details. For example, the Fed has communicated its intent to scale back its asset purchase programs prior to any anticipated rate hikes, and they will likely only begin to do so once inflation has reached a sufficient level of concern. What happens when the Fed is no longer purchasing securities at a time when inflation and interest rates are both increasing?
Preparing for a Range of Outcomes
Our view is largely in-line with the consensus amongst investors and economists, as evidenced by current market-based expectations for inflation. In the below chart, you can see the notable post-pandemic uptick in the Federal Reserve’s preferred inflation indicator, PCE, as well as in the market’s inflation expectations, to a lesser extent.
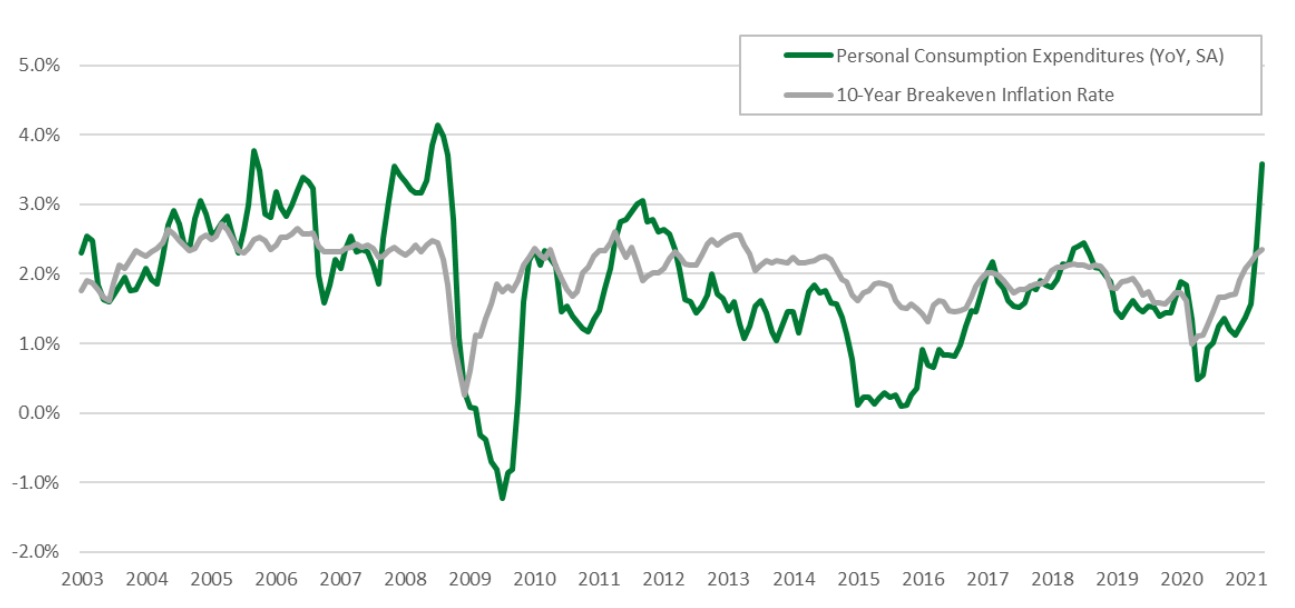
Source: Federal Reserve (01/2003 – 04/2021).
To put a bit more nuance behind market expectations and our outlook, the Federal Reserve’s (Fed) preferred measure of inflation has averaged approximately 1.5%2 annualized over the past decade, whereas current market expectations are for prices to increase around 2.5%3 over the next decade, with prices rising slightly more over the front 5 years as compared to the back 5 years—meaning higher near-term than long-term inflation. Basically, the market believes the Fed will be successful in its efforts to have inflation average 2% over time.
A successful effort by the Fed and other policymakers will likely increase volatility in the markets as investors seek to reprice assets based on a new inflation, interest rate, and policy regime. Inflation concerns are likely to dominate the narrative over the coming months as additional economic data is released and investors update their expectations for the timing and magnitude of policy changes. As such, we have a constructive view on risks assets right now but are actively considering ways in which we can position portfolios for when this concern warrants more proactive action on behalf of our clients.
Enjoying this information? Sign up to have new insights delivered directly to your inbox.
This material contains the opinions of Manning & Napier Advisors, LLC, which are subject to change based on evolving market and economic conditions. This material has been distributed for informational purposes only and should not be considered as investment advice or a recommendation of any particular security, strategy, or investment product. The reader should not assume that investments in the securities identified and discussed were or will be profitable.
1Source: Washington Post.
2Source: Federal Reserve.
3Source: 10-Year Breakeven Inflation Rate (06/01/2021).