
Ebrahim Busheri is the Director of Investments at Manning & Napier. In his more than 30 year investment management career, he has served as Director of Research and as the head of various sector groups within the firm. He has also served as Director of Investments and as a consultant at other firms.
From my viewpoint
Since I spoke with all of you in our last annual outlook, the world has turned basically upside-down.
At times, 2020 felt uncertain, filled with anxiety, and occasionally downright scary. But from the sharp depths of the COVID recession, market conditions have already turned around.
Even as we approach more difficult times, it’s essential to stick to your plan for achieving your financial goals. The worst of times does not mean the market is doomed, and there is plenty of opportunity for those who look ahead.
Our 2021 outlook will let you know how we’re thinking about the year and all of its inevitabilities. While we cannot control the financial climate, we can control the way we invest and plan around uncertainty.
We look forward to the light that will come after this extraordinary period in history. While we await it, we are positioning your portfolio to manage risk while taking advantage of the numerous market opportunities we see today.
There when you need us most
What a challenging time to be an investor. Not only did 2020 ask us to change our lifestyles, work habits, and home life, but it shook our financial lives too.
We’ve been through challenging times like these before: The stagflation of the 70s, the Volcker recessions and Black Monday crash of the 80s, the excesses of the 90s, the Lost Decade of the 00s.
Unknowns and uncertainties will always be part of investing. It’s not about avoiding difficult markets, but thriving alongside them. In 2020, for most of our wealth management clients, we did just that.
We entered the year seeing a number of risks on the horizon, and with markets at all-time highs, we chose to position portfolios in a defensive manner. Once the pandemic hit and the market began to sell off, we stuck to our disciplines. Instead of panicking, we focused on businesses we trusted, and we bought more of them as they began to sell at lower prices. When markets recovered, and they quickly did, our portfolios were already positioned in a much more aggressive manner.
Big picture, last year showed why successful wealth management depends on two things: a repeatable, disciplined investment process that focuses on long-term results over full market cycles; and your plan.
The latter is certainly within your control. Having well-defined, documented answers about your future goals and objectives helps you establish, stick to, and maintain a plan. When markets become volatile, that plan cuts through and clarifies, helping you stay calm and avoid being left behind.
As for the investment part, we know that having a rigorous, time-tested process is a big ask to ‘do it yourself’, but you don’t have to go it alone.
At Manning & Napier, our approach to investment success is about protecting your assets from downturns with a constant, disciplined approach to risk management while being flexible enough to take advantage of market opportunities. This active approach takes time, effort, diligence, and skill, and having decades of experience certainly helps too.
Whatever your financial picture may look like, work with a team that can help you successfully invest for your long-term goals, and who can establish a financial plan for you in the process. We are here to help.
The Fastest Market Selloff & Recovery, Ever
Cumulative Drawdown for S&P 500 Price Index: February 19, 2020 – August 18, 2020
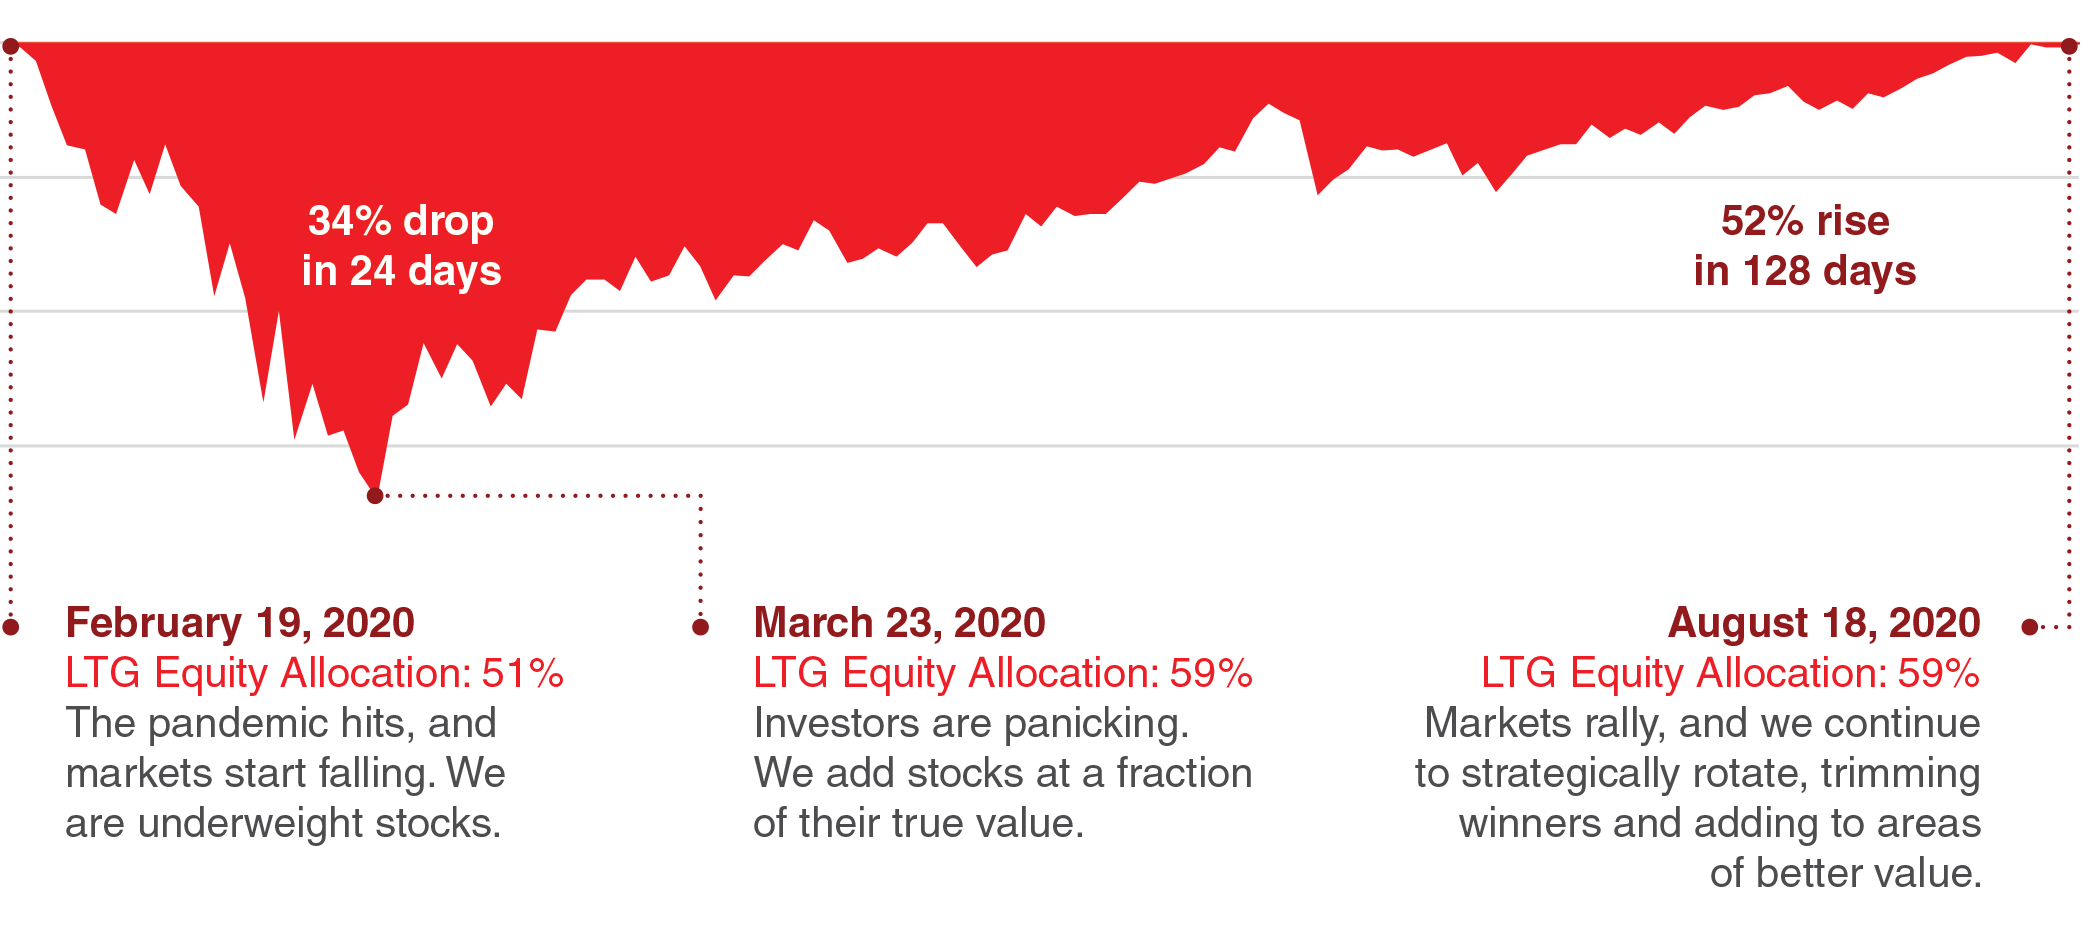
Analysis: Manning & Napier. Source: Morningstar. See last page for disclosures. Equity allocation data provided is based on Long-Term Growth (LTG) model. Neutral equity allocation midpoint is 55%.
Unprecedented uncertainty in unprecedented times
After a relatively calm summer (if anything in a global pandemic can be called calm), the sentiment surrounding COVID and its economic impacts has shifted yet again.
Families, schools, and businesses are all preparing for the worst as a second round of restrictive lockdown measures becomes seemingly inevitable. Not only does this mean more time at home, but potentially more businesses scaling back or shutting down operations, further harming the economy.
On the other hand, tremendous progress in vaccine research is providing hope, and we believe large-scale distribution of a vaccine may happen as early as the first half of 2021. It will take some months and much careful coordination to get vaccines ‘into the US system’, but the reassuring news means that once enough doses have been distributed to achieve herd immunity, we may finally reach a sense of normalcy.
We are optimistic that pent-up demand may fuel strong growth as the economy fully reopens during the latter part of 2021, and perhaps somewhat beyond. 2020 saw the highest US consumer savings rate in the 60-year history of the measure. We believe that the ability to more safely travel and spend may draw that rate back down, boosting growth in the process.
A pent-up demand spike may, however, be short-lived. The COVID-induced recession was very deep, and we fear the longer-term cyclical impacts (i.e., unemployment) may be more stubborn and severe than expected—especially if the desperately needed fiscal support is either too late or too small. In short, our economic forecast is much less robust over the intermediate- to long-term.
Additionally, COVID reinforced several pre-pandemic structural trends. Many corporations have become heavily indebted, and while the consumer has a relatively clean bill of health, deficit-financed government spending is high. Labor market challenges have coincided with a mixed demographic profile as well. While the US has decent demographic trends with the millennial mini-boom, the rest of the developed world is rapidly aging.
With so much cyclical and secular uncertainly hanging over the economy, key questions remain: Can we expect effective policy to help the economy snap back from a cyclical low? What are COVID’s secular, long-term economic impacts, especially on industries like travel and real estate?
All these variables could result in highly differentiated recovery trends across varying regions or countries. With so much left to be determined, investors should avoid making sweeping, all-or-nothing decisions and stay nimble in the months ahead.
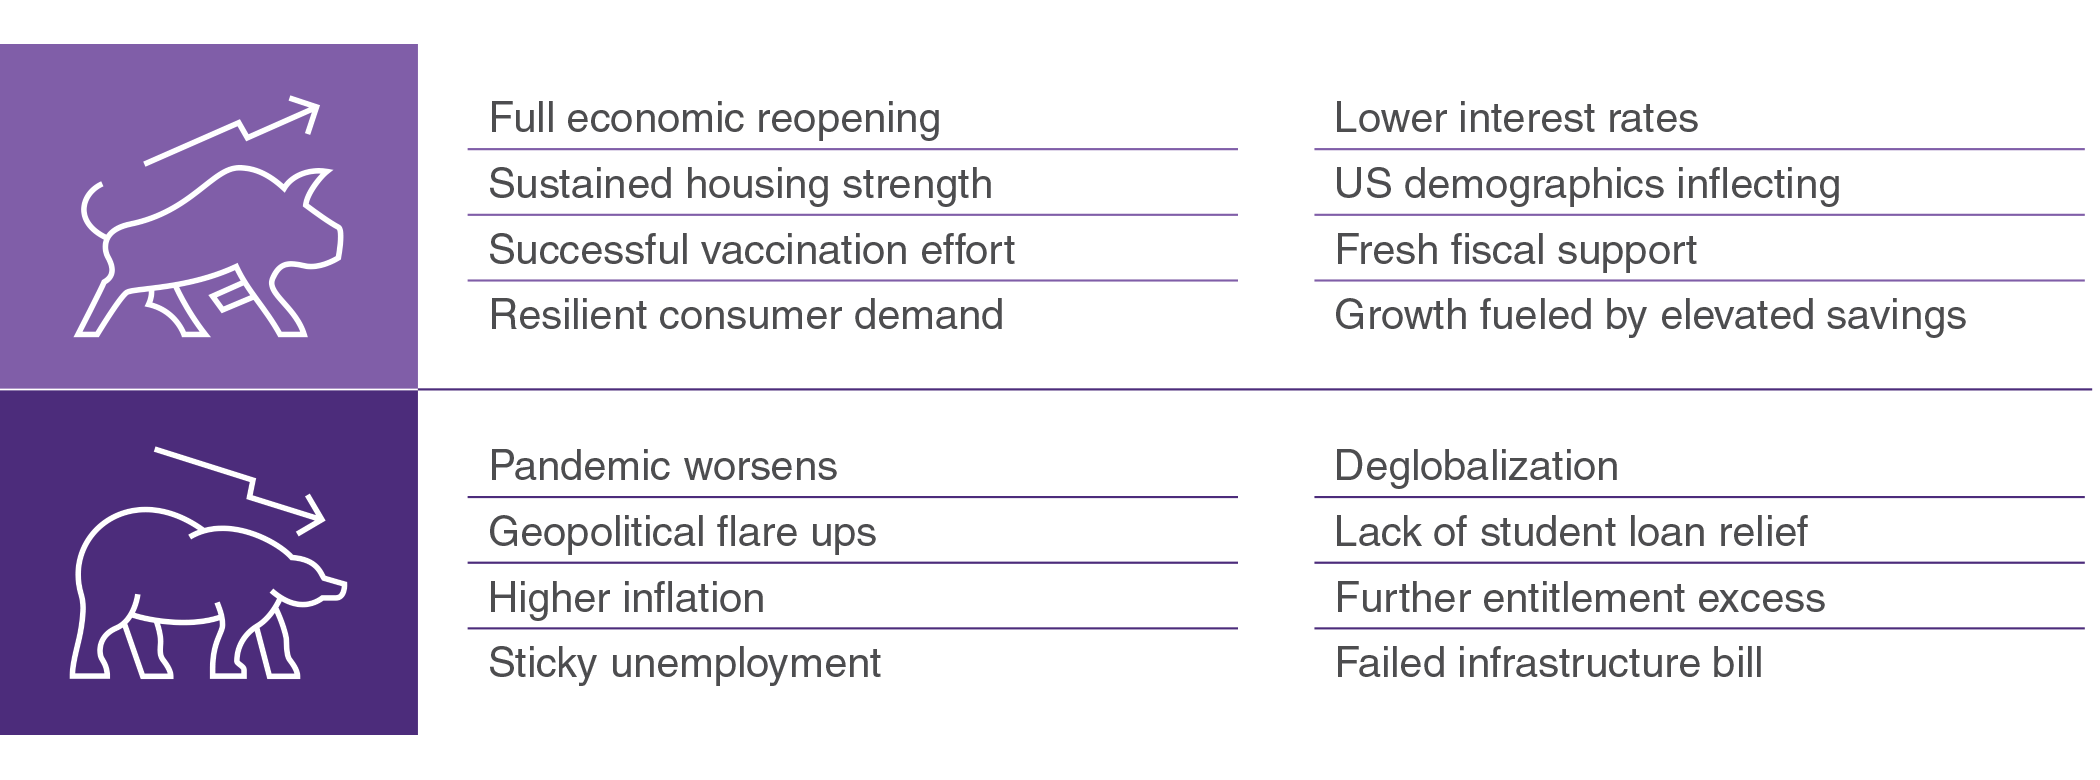
Taking Stock of All the Possibilities
The hunt for yield is back on
Wave two of the pandemic is upon us and businesses, investors, markets, and policymakers are all going to be caught up in it.
Should state and local governments impose new containment measures, then another bout of fiscal support will become even more critical.
Of all government spending, 60% is done at state and local levels. These are the budgets most impacted by COVID. They fund hospitals, first responders, and 911 hotlines. They support an education system under deep strain. They are the ones most directly impacting business in the communities in which you live.
They are also, unfortunately, the most handicapped. They must balance a budget every year, finance projects by issuing debt, and stand up and publicly answer to ‘shareholders’ (aka. taxpayers). And most importantly, unlike the federal government, they do not control the printing press.
The obvious follow up question to another bout of fiscal support is the same question we heard from so many of you last year: Who is going to pay for all this spending? The simple answer is everyone of course, but the reality is more complex.
Ramped up fiscal spending, alongside ultra-low interest rates, may provide another short-term boost to the economy. Yet it may also lead to building underlying pressures in interest rates and inflation—each of which are very sensitive to economic growth expectations. We believe the odds that both inflation and interest rates surprise to the upside are greater than they have been in quite some time. But, to be clear, there are still far too many unknowns and fast-moving variables for us to say with any degree of certainty.
That is why our bond market outlook is less about what we believe will happen specifically, and more about what we believe we should be preparing for when change happens. This is to say, we believe patience will be key. When markets get new information, they often can move swiftly and fiercely, and these sharp reactions can create the best opportunities.
For example, we capitalized on one of these moments last year. As investor fear rose during the chaos of the first quarter selloff, we remained focused on long-term fundamentals. Soon enough, we were able to find compelling yields in municipal bonds, corporate bonds, and a variety of asset-backed securities.
The market gave us a good buying opportunity, and we maintained the flexibility to capitalize on it. In fixed income, staying patient and keeping your eye on the target was one of the pandemic’s key lessons. And if next year is anything like the last, we may not have to wait long for another one.
Low Rates have Become Even Lower
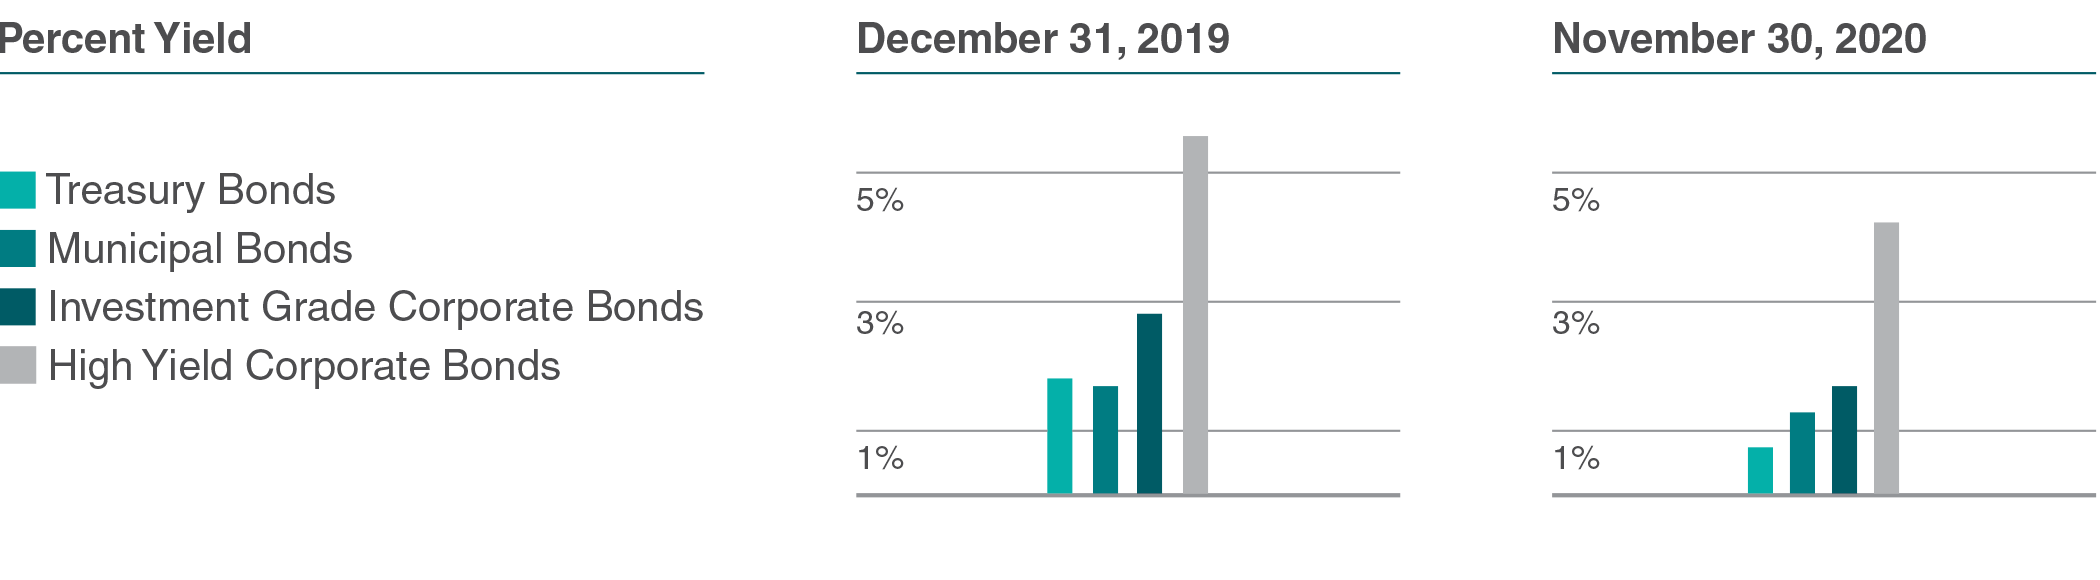
Rate data indices are as follows: 10-Year US Treasury Note, US BoAML Municipal Bond Master Index, US BoAML Corporate Bond Master Index, US BoAML High Yield Cash Pay Master Index. Analysis: Manning & Napier. Sources: US Treasury, Bloomberg. See last page for disclosures.
Multiple ways to win
Now is an incredibly dynamic time to invest in stocks, and today’s market seems to have something for everyone.
You know their names. The high growth companies in areas such as electric vehicles and videoconferencing tools, to heavily beaten down pandemic-impacted industries such as in travel and tourism.
We believe investors who have a robust set of capabilities and wide portfolio flexibility are well positioned for success. Let us explain.
Some businesses are more adaptable to a remote world than others. As we get closer to a full economic reopening, we believe many hampered industries may bounce back in a huge way. At the right price, we expect these economically-sensitive equities (i.e., cyclicals) to be terrific investment opportunities.
For example, we see very good value in the energy sector. As the economy recovers, and as more people begin commuting and traveling again, we believe demand for oil and gas will rebound. Similarly, we also see value in materials, construction raw materials to be specific. A return to normalcy should allow the construction industry to begin working and growing again, aiding suppliers in the process.
We are also seeing better value in two of the pandemic’s most hard-hit industries: travel and real estate. Airlines, hotels, and travel booking services are areas that may bounce back quicker and stronger than many expect.
It is also no secret that the pandemic caused a bad selloff in real estate. Yet we believe the selling was overdone, and we see select opportunities in areas such as data centers, single family housing, apartments, and office space.
While we are excited about new opportunities in these areas, we continue to see potential in many of the same secular growth themes that we have been invested in over the past several years.
These include many pandemic beneficiaries like cloud computing, online gaming, artificial intelligence, semiconductors, and digital advertising, as well as in other less pandemic-related growth opportunities.
For example, we believe the trends benefiting payment processors are solidly intact. We expect mobile data usage to remain a high-growth area, benefiting cellular towers in the process, and we see additional opportunities in biopharmaceuticals, financial services, and consumer staples, just to name a few.
Yes, we still like a number of growth-oriented stocks, but no longer is the market all about the endless pursuit of a handful of growth companies regardless of price. We welcome this return to a more balanced market and look forward to all its newfound investment potential along the way.
Running a Different Race
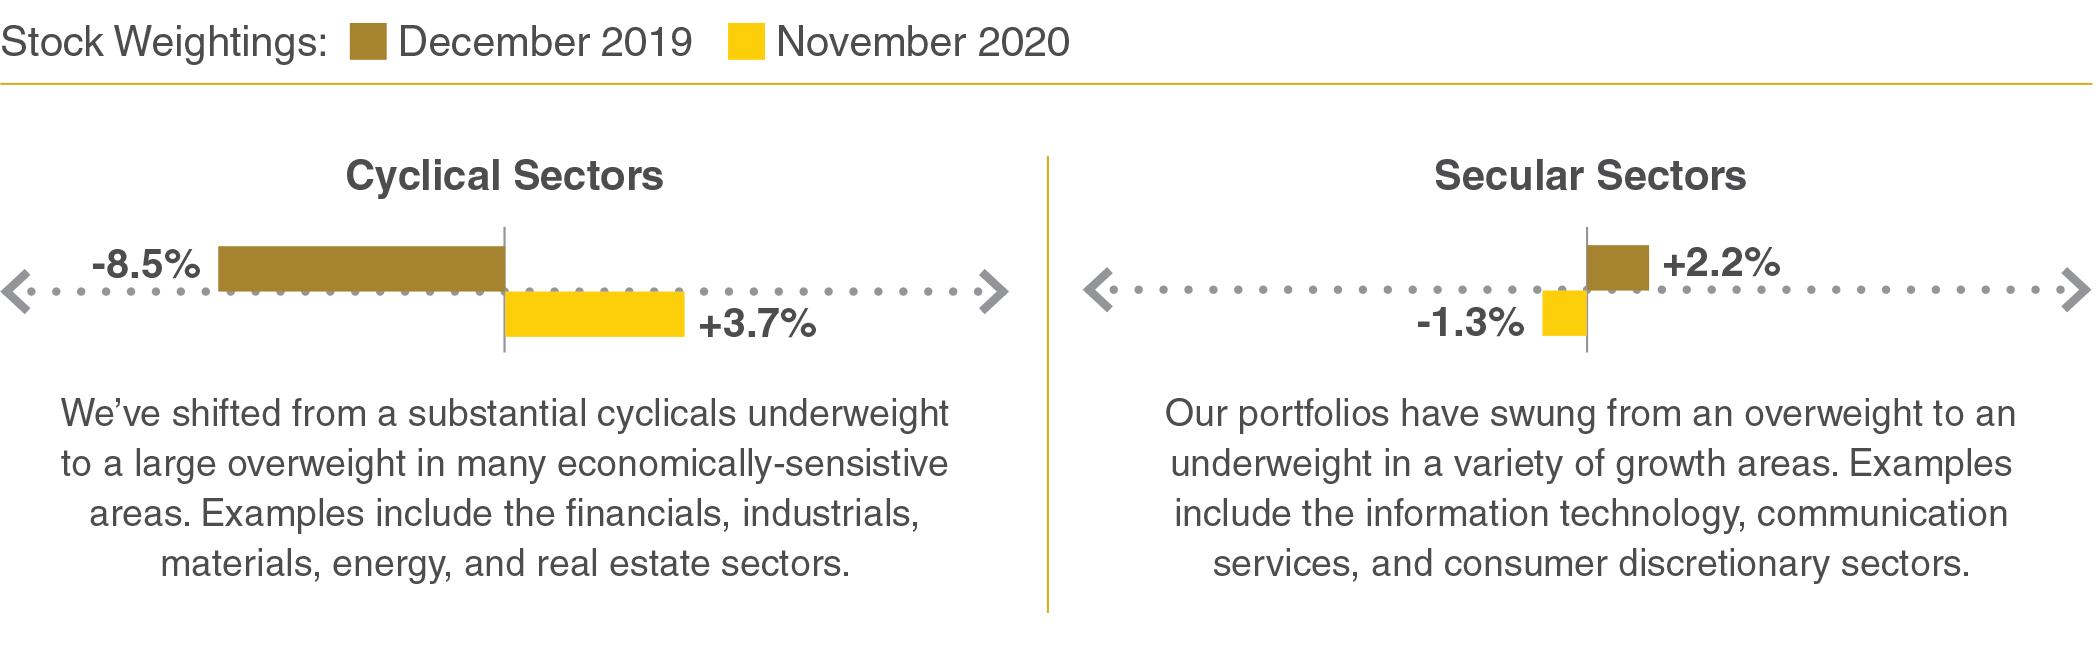
Analysis: Manning & Napier. Sources: FactSet. See last page for disclosures. Data provided based on a Long-Term Growth (LTG) representative account. Sectors defined per Russell 3000 Index. Data as of month end.
Watch Our 2021 Outlook Webinar
In this webinar, our Director of Investments, Ebrahim Busheri, and Veronica Van Nest, Trust Relationship Officer, discuss what investors will need to do to survive and thrive in what promises to be another unpredictable year.
Unless otherwise noted, analysis provided by Manning & Napier. Past performance does not guarantee future results.
The Manning & Napier Long-Term Growth Composite is a weighted average of discretionary separately managed accounts, and may include proprietary mutual fund and collective investment trust accounts with a Long-Term Growth objective. Accounts in this composite must have a market value greater than $500,000 and tenure of at least one month under our management. Long-Term Growth is a blended investment objective that invests in equities, primarily U.S. with some non-U.S., and fixed income securities. The primary investment objective of accounts in this composite is long-term growth, and the secondary objective is preservation of capital. Equity exposure for accounts in this composite typically ranges from 30% to 80% with situational adjustments within this range at our discretion. This composite includes separately managed accounts that may have a portion of their assets invested in proprietary asset class mutual funds, which may be declined or may not be permitted through the selection of some custodial programs. Investments will change over time.
The S&P 500 Price Return Index is an unmanaged, capitalization-weighted measure comprised of 500 leading U.S. companies to gauge U.S. large cap equities. The Index returns do not reflect any fees, expenses, or adjust for cash dividends. The S&P 500 Total Return Index is an unmanaged, capitalization-weighted measure comprised of 500 leading U.S. companies to gauge U.S. large cap equities. The Index returns do not reflect any fees or expenses. The index accounts for the reinvestment of regular cash dividends, but not for the withholding of taxes. Index returns provided by Morningstar?. S&P Dow Jones Indices LLC, a division of S&P Global Inc., is the publisher of various index based data products and services, certain of which have been licensed for use to Manning & Napier. All such content Copyright © 2020 by S&P Dow Jones Indices LLC and/or its affiliates. All rights reserved. Data provided is not a representation or warranty, express or implied, as to the ability of any index to accurately represent the asset class or market sector that it purports to represent and none of these parties shall have any liability for any errors, omissions, or interruptions of any index or the data included therein.
The Intercontinental Exchange (ICE) Bank of America (BofA) U.S. Municipal Securities Index tracks the performance of U.S. dollar denominated investment grade tax-exempt debt publicly issued by U.S. states, territories, and their political subdivisions. Qualifying securities must have at least one year remaining term to final maturity, at least 18 months to final maturity at the time of issuance, a fixed coupon schedule and an investment grade rating. The Index returns do not reflect any fees or expenses.
The Intercontinental Exchange (ICE) Bank of America (BofA) U.S. Corporate Index is an index that tracks the performance of investment-grade corporate debt publicly issued in the U.S. domestic market. The securities must have at least one year remaining term to final maturity as of the rebalancing date, at least 18 months to final maturity at the time of issuance, a fixed coupon schedule, and a minimum amount outstanding of $250 million. The Index returns do not reflect any fees or expenses.
The Intercontinental Exchange (ICE) Bank of America (BofA) U.S. Cash Pay High Yield Index tracks the performance of U.S. dollar denominated below investment grade corporate debt, currently in a coupon paying period, issued in the U.S. domestic market. Qualifying securities must have at least one year remaining term to final maturity as of the rebalancing date, at least 18 months to final maturity at the time of issuance, a fixed coupon schedule, and a minimum amount outstanding of $250 million. The Index returns do not reflect any fees or expenses.
Index data referenced herein is the property of ICE Data Indices, LLC, its affiliates (ICE Data) and/or its Third Party Suppliers and has been licensed for use by Manning & Napier. ICE Data and its Third Party Suppliers accept no liability in connection with its use.
The Russell 3000® Index is an unmanaged index that consists of 3,000 of the largest U.S. companies based on total market capitalization. The Index returns are based on a market capitalization-weighted average of relative price changes of the component stocks plus dividends whose reinvestments are compounded daily. The Index returns do not reflect any fees or expenses. Index returns provided by Factset.
All investments contain risk and may lose value. This material contains the opinions of Manning & Napier Advisors, LLC, which are subject to change based on evolving market and economic conditions. This material has been distributed for informational purposes only and should not be considered as investment advice or a recommendation of any particular security, strategy or investment product. Information contained herein has been obtained from sources believed to be reliable, but not guaranteed.
This publication may contain factual business information concerning Manning & Napier, Inc. and is not intended for the use of investors or potential investors in Manning & Napier, Inc. It is not an offer to sell securities and it is not soliciting an offer to buy any securities of Manning & Napier, Inc.